
S1 January 2010 Q2
2. The 19 employees of a company take an aptitude test. The scores out of 40 are illustrated in the stem and leaf diagram below.
| 2|6 means a score of 26 | ||
| 0 | 7 | (1) |
| 1 | 88 | (2) |
| 2 | 4468 | (4) |
| 3 | 2333459 | (7) |
| 4 | 00000 | (5) |
Find
The company director decides that any employees whose scores are so low that they are outliers will undergo retraining.
An outlier is an observation whose value is less than the lower quartile minus 1.0 times the interquartile range.
| Scheme | Marks |
|---|---|
| Median is 33 | B1 |
| (1) |
| Scheme | Marks |
|---|---|
| \(Q_1 = 24,\ Q_3 = 40,\ \text{IQR} = 16\) | B1 B1 B1ft |
| (3) |
Notes
1st B1 for \(Q_1 = 24\) and 2nd B1 for \(Q_3 = 40\)
3rd B1ft for their IQR based on their lower and upper quartile.
Calculation of range (40 – 7 = 33) is B0B0B0
Answer only of IQR = 16 scores 3/3. For any other answer we must see working in (b) or on stem and leaf diagram
| Scheme | Marks |
|---|---|
| \(Q_1 - \text{IQR} = 24 - 16 = 8\) | M1 |
| So 7 is only outlier | A1ft |
| (2) |
Notes
M1 for evidence that \(Q_1\)-IQR has been attempted, their “8” (>7) seen or clearly attempted is sufficient
A1ft must have seen their “8” and a suitable comment that only one person scored below this.
| Scheme | Marks |
|---|---|
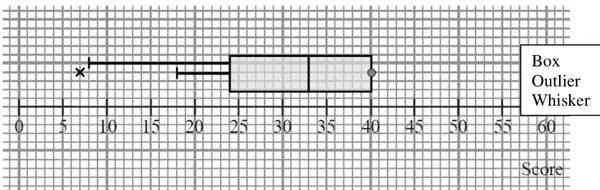 | B1ft (Box) B1 (Outlier) B1ft (Whisker) |
| (3) | |
| (9 marks) |
Notes
1st B1ft for a clear box shape and ft their \(Q_1, Q_2\) and \(Q_3\) readable off the scale.
Allow this mark for a box shape even if \(Q_3 = 40\), \(Q_1 = 7\) and \(Q_2 = 33\) are used
2nd B1 for only one outlier appropriately marked at 7
3rd B1ft for either lower whisker. If they choose the whisker to their lower limit for outliers then follow through their “8”.
(There should be no upper whisker unless their \(Q_3 \lt 40\), in which case there should be a whisker to 40)
A typical error in (d) is to draw the lower whisker to 7, this can only score B1B0B0