
4400 Higher June 2008 Paper 4 Q17
17 The histogram shows information about the heights, \(x\) cm, of some plants.
The histogram is drawn accurately.
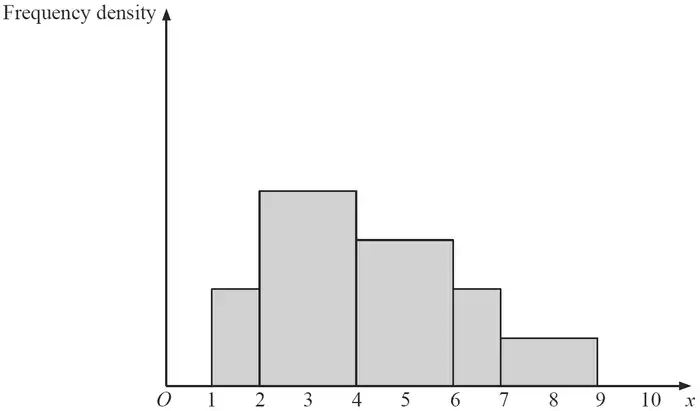
(a) Calculate the percentage of values of \(x\) that lie between 2 and 4. (3)
(b) Find the median of \(x\). (2)
| Scheme | Marks |
|---|---|
| Try to find area of 2-4 block. | M1 |
| Try to find total area. | M1 |
| 40% | A1 |
| (3) |
Notes
M1: or 8
M0 for 2/8 or 9 − 1
M1: With consistent scale.
| Scheme | Marks |
|---|---|
| Half total area or try to find middle of distribution | M1f |
| 4 | A1 |
| (2) | |
| (5 marks) |
Notes
M1f: ft dep on M1 for total area in (a)
A1: Cao