
4400 Higher June 2007 Paper 4 Q20
20 The histogram shows information about the height, \(h\) metres, of some trees.
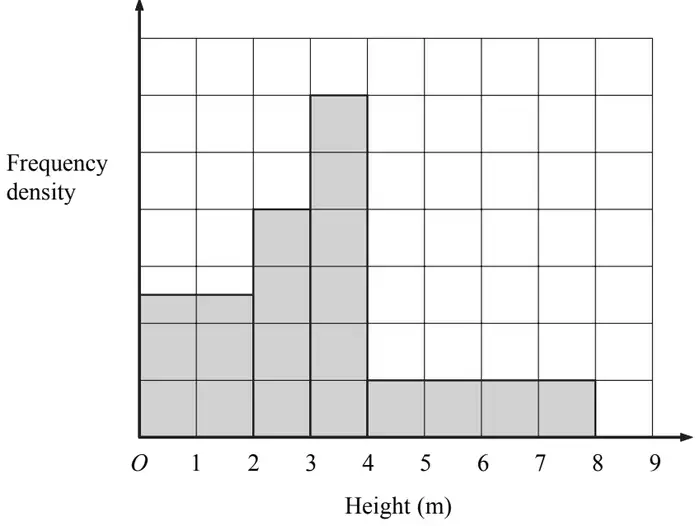
The number of trees with heights in the class \(2 \lt h \leqslant 3\) is 20
Find the number of trees with heights in the class
(i) \(4 \lt h \leqslant 8\)
(ii) \(3 \lt h \leqslant 4\)
(3)
| Scheme | Marks |
|---|---|
| (i) Answer: 20 | B1 |
| (ii) Answer: 30 | B2 |
| (3) | |
| (3 marks) |
Notes
B2: or 1 sq reps freq of 5 seen anywhere: B1