
4MA0 Foundation January 2017 Paper 1 Q20
20
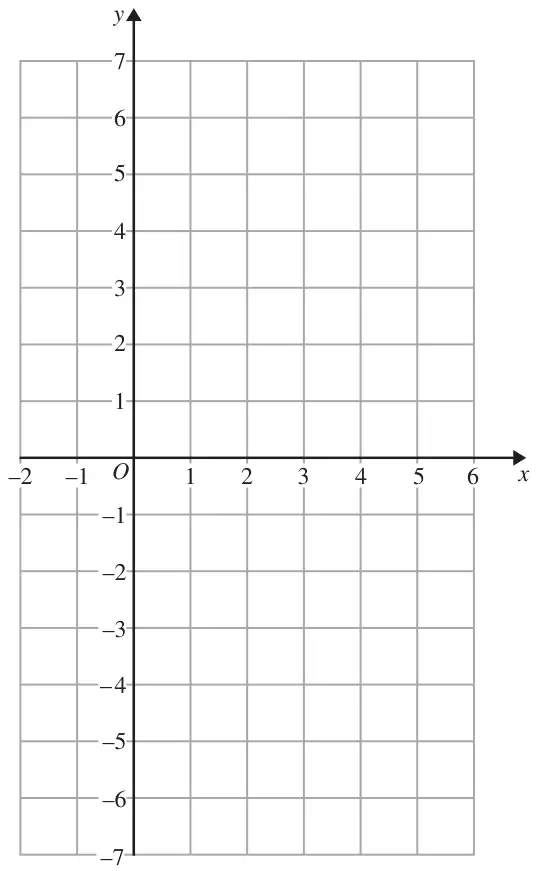
| Scheme | Marks |
|---|---|
| (−1, 6) (0, 4) (1, 2) (2, 0) (3, −2) (4, −4) (5, −6) Answer: Correct line between \(x = -1\) and \(x = 5\) | B4 |
| B3 | |
| B2 | |
| B1 | |
| (4) |
Notes
B4: For a correct line between \(x = -1\) and \(x = 5\)
B3: For a correct line through at least 3 of (−1, 6) (0, 4) (1, 2) (2, 0) (3, −2) (4, −4) (5, −6)
OR
for all of (−1, 6) (0, 4) (1, 2) (2, 0) (3, −2) (4, −4) (5, −6) plotted but not joined.
B2: For at least 2 correct points plotted
B1: For at least 2 correct points stated (may be in a table) or seen in working
OR
for a line drawn with a negative gradient through (0, 4)
OR
for a line with the correct gradient.
| Scheme | Marks |
|---|---|
| M1 | |
| M1 | |
| For correct region identified | A1ft |
| (3) | |
| (7 marks) |
Notes
M1: for \(y = -4\) drawn; accept full or dashed line
NB A shaded rectangle implies a choice of lines so M0
M1: for \(x = 1\) drawn; accept full or dashed line
NB A shaded rectangle implies a choice of lines so M0
A1ft: for correct region identified.
Condone no label if region clear.
ft from an incorrect straight line in part (a)