
1MA0 Higher June 2013 Paper 1 Q12
12 On the grid, draw the graph of \(y = \dfrac{1}{2}x + 5\) for values of \(x\) from \(-2\) to 4 (3)
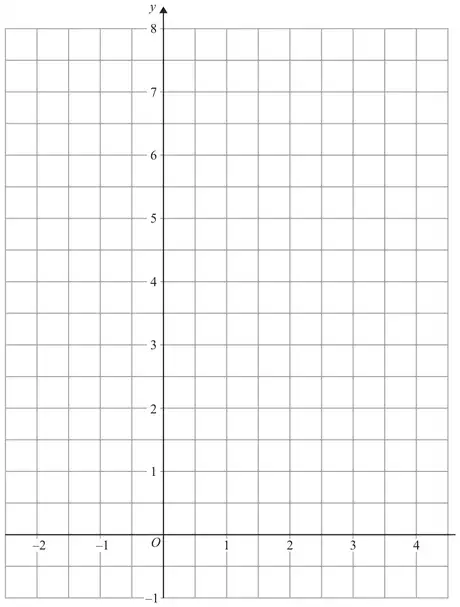
| Answer | Mark | Notes |
|---|---|---|
| \(y = \frac{1}{2}x + 5\) drawn | 3 | (Table of values/calculation of values) M1 for at least 2 correct attempts to find points by substituting values of \(x\). M1 ft for plotting at least 2 of their points (any points plotted from their table must be plotted correctly) A1 for correct line between \(x = -2\) and \(x = 4\) (No table of values) M1 for at least 2 correct points with no more than 2 incorrect points M1 for at least 2 correct points (and no incorrect points) plotted OR line segment of \(y = \frac{1}{2}x + 5\) drawn A1 for correct line between \(x = -2\) and \(x = 4\) (Use of \(y = mx + c\)) M1 for line drawn with gradient 0.5 OR line drawn with \(y\) intercept at 5 M1 for line drawn with gradient 0.5 AND line drawn with \(y\) intercept at 5 A1 For correct line between \(x = -2\) and \(x = 4\) SC B2 for a correct line from \(x = 0\) to \(x = 4\) |
Working
| \(x\) | \(-2\) | \(-1\) | 0 | 1 | 2 | 3 | 4 |
|---|---|---|---|---|---|---|---|
| \(y\) | 4 | 4.5 | 5 | 5.5 | 6 | 6.5 | 7 |