
1MA0 Foundation June 2015 Paper 1 Q1
1 Here is a pictogram.
It shows the number of TVs sold in a shop on Thursday, on Friday and on Saturday.
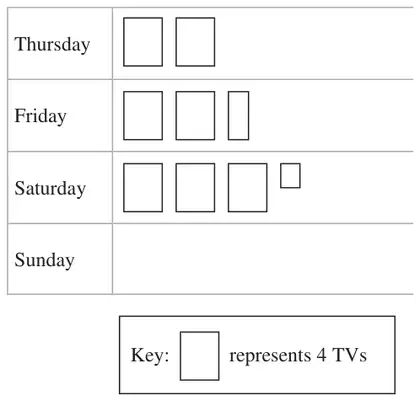
On Sunday the shop sold 6 TVs.
(a) Use this information to complete the pictogram. (1)
(b) Work out the total number of TVs sold on these four days. (2)
| Answer | Mark | Notes |
|---|---|---|
| 1 | B1 for 6 TVs drawn for Sunday |
| Answer | Mark | Notes |
|---|---|---|
| 37 | 2 | M1 for attempt to find the total for 4 days (eg 8+10+13+6) by adding individual days with at least 3 days correct A1 cao |