
D2 June 2018 Q4
4.
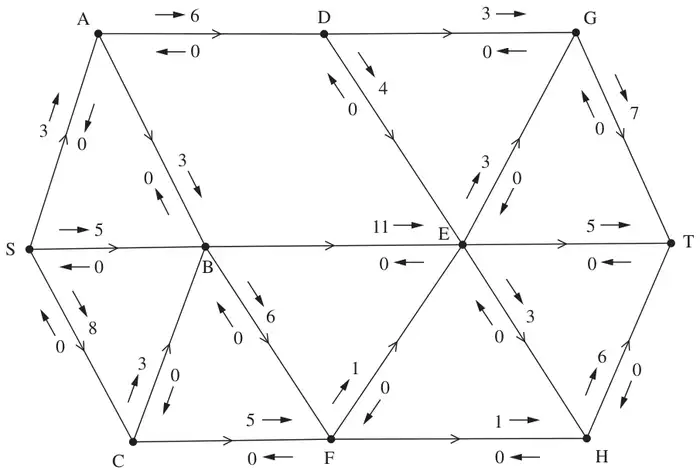
Figure 1 represents a system of pipes through which fluid can flow from the source node, S, to the sink node, T. The labelling procedure has been applied to Figure 1, and the numbers on the arrows, either side of each arc, show the excess capacities and potential backflows.
Currently, no fluid is flowing through the system.
| Scheme | Marks |
|---|---|
| Capacity of cut = 7 + 4 + 11 + 1 + 1 = 24 | B1 |
| (1) |
Notes
a1B1: CAO (24)
| Scheme | Marks |
|---|---|
| The capacity of arc DG is 3 and the capacity of arc EG is also 3 and so the maximum that can flow in GT is 6 < 7 (the capacity of arc GT) and so GT cannot be full to capacity | B1 |
| (1) |
Notes
b1B1: CAO – max. flow into G is 6, max flow out of G is 7 – answer must be numerical in nature (must contain 6 and 7)
| Scheme | Marks |
|---|---|
 | B1 |
| Maximum flow through SBET is 5 | B1 |
| (2) |
Notes
c1B1: CAO (showing flow of 5 along SBET)
c2B1: CAO (maximum flow along SBET is 5)
| Scheme | Marks | ||||||||||||||||
|---|---|---|---|---|---|---|---|---|---|---|---|---|---|---|---|---|---|
e.g.
For reference: 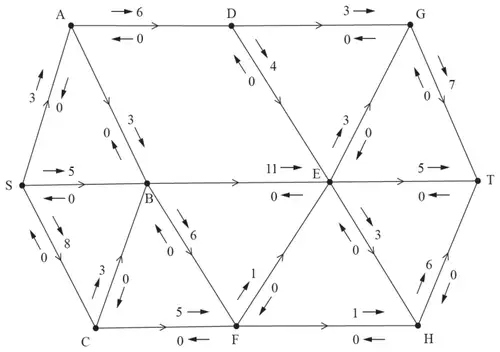 | M1 A1 A1 A1 | ||||||||||||||||
| (4) |
Notes
d1M1: One valid flow augmenting route found and any value stated
d1A1: Two correct flow routes and values correct
d2A1: Three correct flow routes and values correct
d3A1: CSO flow increased by 8 and no more
For (d) as a guide SA must be increased by 3, SC by 5, CB by 3, nothing in SB, BF or ET, FE by 1 and FH by 1
| Scheme | Marks |
|---|---|
| Max flow is 13 | B1 |
| Cut through SA, SB, CB, BF, FE and FH (has a capacity of 13) | B1 |
| (2) |
Notes
e1B1: CAO (13)
e2B1: CAO (cut through SA, SB, CB, BF, FE, FH) - stated or shown
| Scheme | Marks |
|---|---|
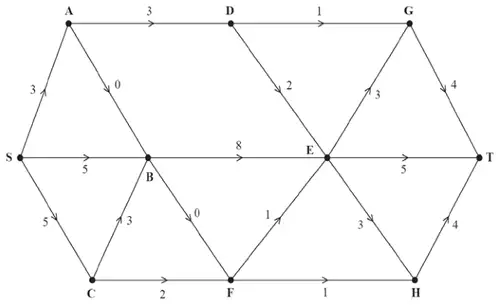 | M1 A1 |
| (2) | |
| 12 marks |
Notes
f1M1: Consistent flow pattern \(\geqslant 11\). Must have exactly one number on each arc
f1A1: CAO
For (f) as a guide SA = 3, SB = 5, SC = 5, CB = 3, CF = 2, BF = 0, FE = 1, FH = 1, ET = 5