
D2 June 2013 Q3
3.
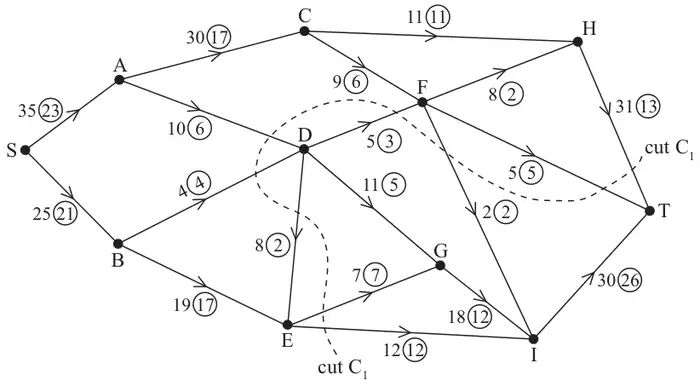
Figure 1 shows a capacitated, directed network. The number on each arc represents the capacity of that arc. The numbers in circles represent an initial flow.
The labelling procedure has been used and the result drawn on Diagram 1 in the answer book.
| Scheme | Marks |
|---|---|
| Initial flow = 44 | B1 |
| (1) |
Notes
a1B1 CAO
| Scheme | Marks |
|---|---|
| Value of cut = 12+7+4+10+2+5+31 = 71 | B1 |
| (1) |
Notes
b1B1 CAO
(The printed scheme shows the marks for (a) and (b) together as (2).)
| Scheme | Marks |
|---|---|
| e.g. SACFHT – 3; SADGIT – 4; SBEDFHT – 2 e.g. SACFHT – 3; SADFHT – 2; SADGIT – 2; SBEDGIT - 2 | M1 A1; A1; A1 |
| (4) |
Notes
c1M1 One valid flow augmenting route found and a value stated.
c1A1 Flow increased by at least 2
c2A1 A second correct flow route (and value at least 2) correct
c3A1 CSO Flow increased by 9 and no more.
Guidance for 3(c)
SA +7 SB +2 AC +3 AD +4 BD none BE + 2
ED + 2 CH none CF +3 EG none EI none
(DF+2 DG+2 FH +5 FT none FI none GI +4 HT +5 IT +4)
| Scheme | Marks |
|---|---|
e.g.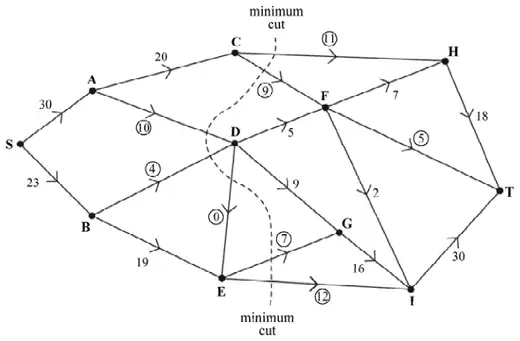 | M1 A1 |
| (2) |
Notes
d1M1 Consistent flow pattern > 50 (check each node, must have exactly 1 number per arc)
d1A1 CAO, showing flow of 53, must follow from their routes.
| Scheme | Marks |
|---|---|
| Maximum flow=minimum cut e.g. cut through CH, CF, AD, BD, DE, EG and EI | DM1 A1 |
| (2) | |
| (10 marks) |
Notes
e1DM1 Must have attempted (d) and made an attempt at a cut.
e1A1 cut correct – may be drawn. Refer to max flow-min cut theorem all four words (alternative cut: CH, CF, AD, BD, BE).