
C4 June 2006 Q6
6.
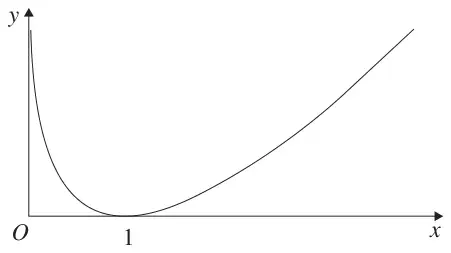
Figure 3 shows a sketch of the curve with equation \(y = (x - 1)\ln x\), \(x \gt 0\).
| \(x\) | 1 | 1.5 | 2 | 2.5 | 3 |
| \(y\) | 0 | \(\ln 2\) | \(2\ln 3\) |
Given that \(I = \displaystyle\int_1^3 (x - 1)\ln x\,\mathrm{d}x\),
| \(x\) | 1 | 1.5 | 2 | 2.5 | 3 |
| \(y\) | 0 | \(0.5\ln 1.5\) | \(\ln 2\) | \(1.5\ln 2.5\) | \(2\ln 3\) |
| or \(y\) | 0 | 0.2027325541… | \(\ln 2\) | 1.374436098… | \(2\ln 3\) |
| Scheme | Marks |
|---|---|
| Either \(0.5\ln 1.5\) and \(1.5\ln 2.5\) or awrt 0.20 and 1.37 (or mixture of decimals and ln’s) | B1 |
| (1) |
| Scheme | Marks |
|---|---|
| (i) \(I_1 \approx \dfrac{1}{2} \times 1 \times\) \(\underline{\left\{0 + 2(\ln 2) + 2\ln 3\right\}}\) | M1; |
| \(= \dfrac{1}{2} \times 3.583518938\ldots = 1.791759\ldots = 1.792\) (4sf) | A1 cao |
| (ii) \(I_2 \approx \dfrac{1}{2} \times 0.5\ ; \times \underline{\left\{0 + 2(0.5\ln 1.5 + \ln 2 + 1.5\ln 2.5) + 2\ln 3\right\}}\) | B1; M1ft |
| \(= \dfrac{1}{4} \times 6.737856242\ldots = 1.684464\ldots\) | A1 |
| (5) |
Notes
M1 For structure of trapezium rule \(\{\ldots\ldots\ldots\}\);
A1 1.792
B1 Outside brackets \(\frac{1}{2} \times 0.5\)
M1ft For structure of trapezium rule \(\{\ldots\ldots\ldots\}\);
A1 awrt 1.684
Beware: In part (b) candidate can add up the individual trapezia:
(b)(i) \(I_1 \approx \frac{1}{2}(0 + \ln 2) + \frac{1}{2}(\ln 2 + \ln 3)\)
(ii) \(I_2 \approx \frac{1}{2}\cdot\frac{1}{2}(0 + 0.5\ln 1.5) + \frac{1}{2}\cdot\frac{1}{2}(0.5\ln 1.5 + \ln 2) + \frac{1}{2}\cdot\frac{1}{2}(\ln 2 + 1.5\ln 2.5) + \frac{1}{2}\cdot\frac{1}{2}(1.5\ln 2.5 + 2\ln 3)\)
| Scheme | Marks |
|---|---|
| With increasing ordinates, the line segments at the top of the trapezia are closer to the curve. | B1 |
| (1) |
Notes
B1 Reason or an appropriate diagram elaborating the correct reason.
| Scheme | Marks |
|---|---|
| \(\left\{\begin{aligned} u &= \ln x \Rightarrow \tfrac{\mathrm{d}u}{\mathrm{d}x} = \tfrac{1}{x} \\ \tfrac{\mathrm{d}v}{\mathrm{d}x} &= x - 1 \Rightarrow v = \tfrac{x^2}{2} - x \end{aligned}\right\}\) | |
| \(I = \left(\dfrac{x^2}{2} - x\right)\ln x - \displaystyle\int \frac{1}{x}\left(\frac{x^2}{2} - x\right)\mathrm{d}x\) | M1 A1 |
| \(= \left(\dfrac{x^2}{2} - x\right)\ln x - \underline{\displaystyle\int \left(\frac{x}{2} - 1\right)\mathrm{d}x}\) | |
| \(= \left(\dfrac{x^2}{2} - x\right)\ln x - \underline{\left(\dfrac{x^2}{4} - x\right)}\quad (+c)\) | M1; A1 |
| \(\therefore I = \left[\left(\dfrac{x^2}{2} - x\right)\ln x - \dfrac{x^2}{4} + x\right]_1^3\) | |
| \(= \left(\frac{3}{2}\ln 3 - \frac{9}{4} + 3\right) - \left(-\frac{1}{2}\ln 1 - \frac{1}{4} + 1\right)\) | ddM1 |
| \(= \frac{3}{2}\ln 3 + \frac{3}{4} + 0 - \frac{3}{4} = \underline{\frac{3}{2}\ln 3}\) AG | A1 cso |
| (6) | |
| (13 marks) |
Notes
M1 Use of ‘integration by parts’ formula in the correct direction
A1 Correct expression
M1; An attempt to multiply at least one term through by \(\frac{1}{x}\) and an attempt to … … integrate;
A1 correct integration
ddM1 Substitutes limits of 3 and 1 and subtracts.
A1 cso \(\frac{3}{2}\ln 3\)
Aliter (d) Way 2
| \(\displaystyle\int (x - 1)\ln x\,\mathrm{d}x = \int x\ln x\,\mathrm{d}x - \int \ln x\,\mathrm{d}x\) | |
| \(\displaystyle\int x\ln x\,\mathrm{d}x = \frac{x^2}{2}\ln x - \int \frac{x^2}{2}\cdot\left(\frac{1}{x}\right)\mathrm{d}x\) | M1 |
| \(= \dfrac{x^2}{2}\ln x - \dfrac{x^2}{4}\quad (+c)\) | A1 |
| \(\displaystyle\int \ln x\,\mathrm{d}x = x\ln x - \int x\cdot\left(\frac{1}{x}\right)\mathrm{d}x\) | M1 |
| \(= x\ln x - x\quad (+c)\) | A1 |
| \(\therefore \displaystyle\int_1^3 (x - 1)\ln x\,\mathrm{d}x = \left(\tfrac{9}{2}\ln 3 - 2\right) - (3\ln 3 - 2) = \tfrac{3}{2}\ln 3\) AG | ddM1 A1 cso |
| [6] |
M1 Correct application of ‘by parts’
A1 Correct integration
M1 Correct application of ‘by parts’
A1 Correct integration
ddM1 Substitutes limits of 3 and 1 into both integrands and subtracts.
A1 cso \(\frac{3}{2}\ln 3\)
Aliter (d) Way 3
| \(\left\{\begin{aligned} u &= \ln x \Rightarrow \tfrac{\mathrm{d}u}{\mathrm{d}x} = \tfrac{1}{x} \\ \tfrac{\mathrm{d}v}{\mathrm{d}x} &= (x - 1) \Rightarrow v = \tfrac{(x - 1)^2}{2} \end{aligned}\right\}\) | |
| \(I = \dfrac{(x - 1)^2}{2}\ln x - \displaystyle\int \frac{(x - 1)^2}{2x}\,\mathrm{d}x\) | M1 A1 |
| \(= \dfrac{(x - 1)^2}{2}\ln x - \displaystyle\int \frac{x^2 - 2x + 1}{2x}\,\mathrm{d}x\) \(= \dfrac{(x - 1)^2}{2}\ln x - \underline{\displaystyle\int \left(\frac{1}{2}x - 1 + \frac{1}{2x}\right)\mathrm{d}x}\) | |
| \(= \dfrac{(x - 1)^2}{2}\ln x - \underline{\left(\dfrac{x^2}{4} - x + \dfrac{1}{2}\ln x\right)}\quad (+c)\) | M1; A1 |
| \(\therefore I = \left[\dfrac{(x - 1)^2}{2}\ln x - \dfrac{x^2}{4} + x - \dfrac{1}{2}\ln x\right]_1^3\) | |
| \(= \left(2\ln 3 - \frac{9}{4} + 3 - \frac{1}{2}\ln 3\right) - \left(0 - \frac{1}{4} + 1 - 0\right)\) | ddM1 |
| \(= 2\ln 3 - \frac{1}{2}\ln 3 + \frac{3}{4} + \frac{1}{4} - 1 = \underline{\frac{3}{2}\ln 3}\) AG | A1 cso |
| [6] |
M1 Use of ‘integration by parts’ formula in the correct direction
A1 Correct expression
M1; Candidate multiplies out numerator to obtain three terms… … multiplies at least one term through by \(\frac{1}{x}\) and then attempts to … … integrate the result;
A1 correct integration
ddM1 Substitutes limits of 3 and 1 and subtracts.
A1 cso \(\frac{3}{2}\ln 3\)
Beware: \(\displaystyle\int \frac{1}{2x}\,\mathrm{d}x\) can also integrate to \(\dfrac{1}{2}\ln 2x\)
Beware: If you are marking using WAY 2 please make sure that you allocate the marks in the order they appear on the mark scheme. For example if a candidate only integrated \(\ln x\) correctly then they would be awarded M0A0M1A1M0A0 on ePEN.
Aliter (d) Way 4: By substitution
| \(u = \ln x \Rightarrow \frac{\mathrm{d}u}{\mathrm{d}x} = \frac{1}{x}\) \(I = \displaystyle\int (\mathrm{e}^u - 1).u\mathrm{e}^u\,\mathrm{d}u\) | |
| \(= \displaystyle\int u(\mathrm{e}^{2u} - \mathrm{e}^u)\,\mathrm{d}u\) | M1 |
| \(= u\left(\dfrac{1}{2}\mathrm{e}^{2u} - \mathrm{e}^u\right) - \underline{\displaystyle\int \left(\frac{1}{2}\mathrm{e}^{2u} - \mathrm{e}^u\right)\mathrm{d}x}\) | A1 |
| \(= u\left(\dfrac{1}{2}\mathrm{e}^{2u} - \mathrm{e}^u\right) - \underline{\left(\dfrac{1}{4}\mathrm{e}^{2u} - \mathrm{e}^u\right)}\quad (+c)\) | M1; A1 |
| \(\therefore I = \left[\dfrac{1}{2}u\mathrm{e}^{2u} - u\mathrm{e}^u - \dfrac{1}{4}\mathrm{e}^{2u} + \mathrm{e}^u\right]_{\ln 1}^{\ln 3}\) | |
| \(= \left(\frac{9}{2}\ln 3 - 3\ln 3 - \frac{9}{4} + 3\right) - \left(0 - 0 - \frac{1}{4} + 1\right)\) | ddM1 |
| \(= \frac{3}{2}\ln 3 + \frac{3}{4} + \frac{1}{4} - 1 = \underline{\frac{3}{2}\ln 3}\) AG | A1 cso |
| [6] |
Correct expression
M1 Use of ‘integration by parts’ formula in the correct direction
A1 Correct expression
M1; Attempt to integrate;
A1 correct integration
ddM1 Substitutes limits of \(\ln 3\) and \(\ln 1\) and subtracts.
A1 cso \(\frac{3}{2}\ln 3\)