
C4 June 2005 Q5
5.
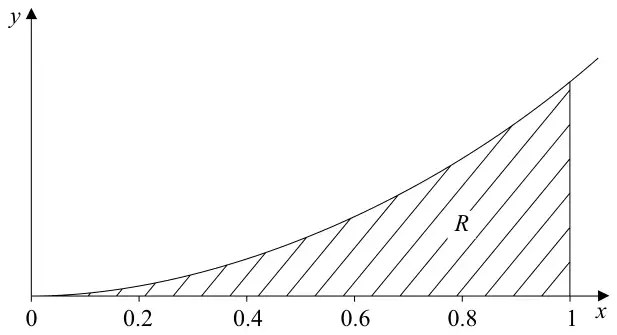
Figure 1 shows the graph of the curve with equation
\[y = x\mathrm{e}^{2x}, \qquad x \geqslant 0.\]
The finite region \(R\) bounded by the lines \(x = 1\), the \(x\)-axis and the curve is shown shaded in Figure 1.
(a) Use integration to find the exact value for the area of \(R\). (5)
(b) Complete the table with the values of \(y\) corresponding to \(x = 0.4\) and 0.8.
(1)
| \(x\) | 0 | 0.2 | 0.4 | 0.6 | 0.8 | 1 |
| \(y = x\mathrm{e}^{2x}\) | 0 | 0.29836 | 1.99207 | 7.38906 |
(c) Use the trapezium rule with all the values in the table to find an approximate value for this area, giving your answer to 4 significant figures. (4)
| Scheme | Marks |
|---|---|
| \(\displaystyle\int x\mathrm{e}^{2x}\,\mathrm{d}x = \frac{1}{2}x\mathrm{e}^{2x} - \frac{1}{2}\int \mathrm{e}^{2x}\,\mathrm{d}x\) Attempting parts in the right direction | M1 A1 |
| \(= \dfrac{1}{2}x\mathrm{e}^{2x} - \dfrac{1}{4}\mathrm{e}^{2x}\) | A1 |
| \(\left[\dfrac{1}{2}x\mathrm{e}^{2x} - \dfrac{1}{4}\mathrm{e}^{2x}\right]_0^1 = \dfrac{1}{4} + \dfrac{1}{4}\mathrm{e}^2\) | M1 A1 |
| (5) |
| Scheme | Marks |
|---|---|
| \(x = 0.4 \Rightarrow y \approx 0.89022\) \(x = 0.8 \Rightarrow y \approx 3.96243\) Both are required to 5 d.p. | B1 |
| (1) |
| Scheme | Marks |
|---|---|
| \(I \approx \dfrac{1}{2} \times 0.2 \times [\ \ldots\ ]\) | B1 |
| \(\approx \ldots \times \left[0 + 7.38906 + 2(0.29836 + .89022 + 1.99207 + 3.96243)\right]\) ft their answers to (b) | M1 A1ft |
| \(\approx 0.1 \times 21.67522\) | |
| \(\approx 2.168\) cao | A1 |
| (4) | |
| (10 marks) |
Notes
Note \(\dfrac{1}{4} + \dfrac{1}{4}\mathrm{e}^2 \approx 2.097\ \ldots\)