
C1 June 2008 Q3
3.
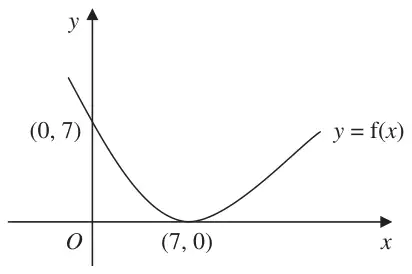
Figure 1 shows a sketch of the curve with equation \(y = \mathrm{f}(x)\). The curve passes through the point \((0, 7)\) and has a minimum point at \((7, 0)\).
On separate diagrams, sketch the curve with equation
On each diagram, show clearly the coordinates of the minimum point and the coordinates of the point at which the curve crosses the \(y\)-axis.
| Scheme | Marks |
|---|---|
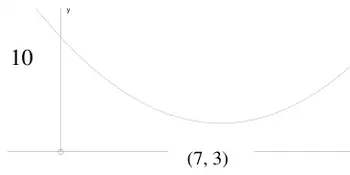 | B1B1B1 |
| (3) |
Notes
Allow “stopping at” (0, 10) or (0, 7) instead of “cutting”
1st B1: for moving the given curve up. Must be U shaped curve, minimum in first quadrant, not touching \(x\)-axis but cutting positive \(y\)-axis. Ignore any values on axes.
2nd B1: for curve cutting \(y\)-axis at (0, 10). Point 10(or even (10, 0) marked on positive \(y\)-axis is OK)
3rd B1: for minimum indicated at (7, 3). Must have both coordinates and in the right order.
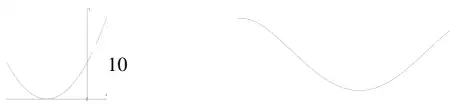
this would score B0B1B0
If the curve flattens out to a turning point like this penalise once at first offence ie 1st B1 in (a) or in (b) but not in both.
The U shape mark can be awarded if the sides are fairly straight as long as the vertex is rounded.
| Scheme | Marks |
|---|---|
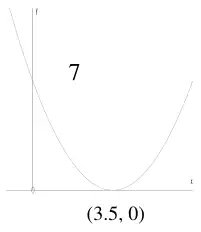 | B1B1 |
| (2) | |
| (5 marks) |
Notes
1st B1: for U shaped curve, touching positive \(x\)-axis and crossing \(y\)-axis at (0, 7)[condone (7, 0) if marked on positive \(y\) axis] or 7 marked on \(y\)-axis
2nd B1: for minimum at (3.5, 0) or 3.5 or \(\dfrac{7}{2}\) marked on \(x\)-axis. Do not condone (0, 3.5) here.
Redrawing \(\mathrm{f}(x)\) will score B1B0 in part (b).
Points on sketch override points given in text/table.
If coordinates are given elsewhere (text or table) marks can be awarded if they are compatible with the sketch.
The U shape mark can be awarded if the sides are fairly straight as long as the vertex is rounded.