
Higher November 2020 Paper 2R Q21
21 The histogram gives information about the times, in minutes, some customers had to wait to be served in a restaurant.
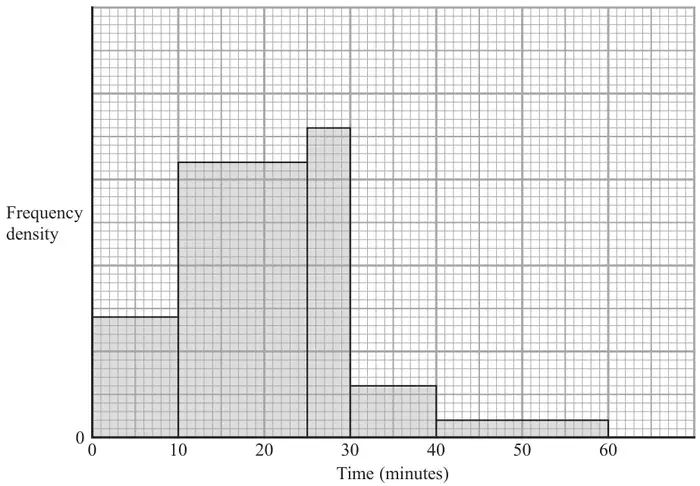
14 customers had to wait less than 10 minutes to be served.
Work out the number of customers who had to wait less than 60 minutes to be served.
(3)
| Scheme | Marks |
|---|---|
14 ÷ 10 (= 1.4) or at least two of (3.2 × 15 (=48) or 3.6 × 5 (=18) or 0.6 × 10 (=6) or 0.2 × 20 (=4) or at least two of (140, 480, 180, 60, 40) or \(\dfrac{14}{140} = \left(\dfrac{1}{10}\right)\) | M1 |
14 + 3.2 × 15 + 3.6 × 5 + 0.6 × 10 + 0.2 × 20 or 14 + 48 + 18 + 6 + 4 or (140 + 480 + 180 + 60 + 40) × \(\dfrac{1}{10}\) or 900 × \(\dfrac{1}{10}\) | M1 |
| 90 | A1 |
| (3) | |
| (3 marks) |
Notes
M1: for any one correct frequency density or 1cm2 = 2.5 or association of area with frequency eg one small square = 0.1 (on vertical axis)
M1: for any correct method
Allow one error in their total (error may include missing a total for a bar)
A1: answer from correct working