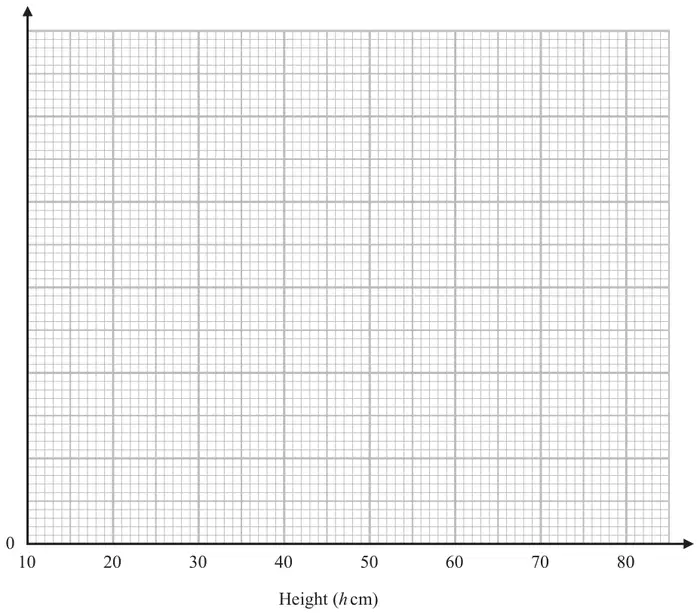
35 ÷ 10 (=3.5) and 45 ÷ 15 (=3) and 75 ÷ 15 (=5) and 40 ÷ 20 (=2) and (8 ÷ 10) = 0.8
M1
Correct histogram
A1
(3)
Notes
M1: for any two correct fd or two correct bars drawn of different widths
M1: for all correct fd or at least 3 correct bars drawn
A1: for a fully correct histogram with ‘frequency density’ (or fd) and scale on the axis labelled or appropriate key (SC: B2 for all five bars drawn of correct width with heights in the correct ratio) (SC: B1 for three bars drawn of correct width with heights in the correct ratio)
Mark scheme (b)
Scheme
Marks
10 × 5 + 40 + 8 or
\(\dfrac{2}{3} \times 75 + 40 + 8\)
M1
Correct answer scores full marks (unless from obvious incorrect working) Answer: 98
A1
(2)
(5 marks)
Notes
M1: ft from their histogram in (a) for a correct method