
Higher January 2020 Paper 2 Q18
18 The histogram gives information about the times, in minutes, that some customers spent in a supermarket.
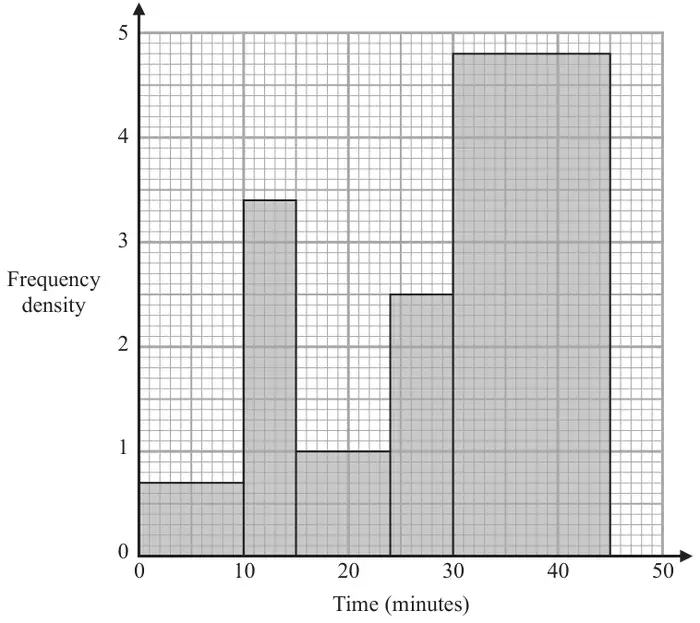
(a) Work out an estimate for the proportion of these customers who spent between 17 minutes and 35 minutes in the supermarket. (3)
One of the customers is selected at random.
Given that this customer had spent more than 30 minutes in the supermarket,
(b) find the probability that this customer spent more than 36 minutes in the supermarket. (2)
| Scheme | Marks |
|---|---|
| (0.7 × 10) + (3.4 × 5) + (1 × 9) + (2.5 × 6) + (4.8 × 15) = 7 + 17 + 9 + 15 + 72 (= 120) no. of sml squares = (10 × 7) + (5 × 34) + (9 × 10) + (6 × 25) + (15 × 48) = 70 + 170 + 90 + 150 + 720 (= 1200) or all correct values in bars oe not added | M1 |
| (1 × 7) + (2.5 × 6) + (5 × 4.8) = 7 + 15 + 24 (= 46) or no. of sml squares (48 × 5) + (6 × 25) + (7 × 10) = 240 + 150 + 70 (= 460) | M1 |
\(\dfrac{46}{120}\) Answer: \(\dfrac{46}{120}\) | A1 |
| (3) |
Notes
M1: for a correct method to work out the total area eg total frequency or number of small squares or other correct method (allow one error in method) [count use of 25 for 24 as one error]
or all correct values in bars oe not added
M1: for a correct method to work out the area between 17 minutes and 35 minutes
eg using frequency density or number of small squares oe
A1: for \(\dfrac{46}{120}\) oe (allow 2 dp or better 0.3833... or 38% or better)
| Scheme | Marks |
|---|---|
| M1 | |
| \(\dfrac{9}{15}\) | A1 |
| (2) | |
| (5 marks) |
Notes
M1: for \(\dfrac{n}{15}\) where \(n \lt 15\) or \(\dfrac{q}{720}\) where \(q \lt 720\) or \(\dfrac{r}{72}\) where \(r \lt 72\) or
\(\dfrac{9}{m}\) where \(m \gt 9\) or \(\dfrac{432}{p}\) where \(p \gt 432\)
\(\dfrac{43.2}{t}\) where \(t \gt 43.2\)
A1: \(\dfrac{9}{15}\) oe