
Foundation June 2022 Paper 2R Q2
2 The bar chart gives information about the total number, in millions, of cars produced in 2017 and 2018 for each of five countries.
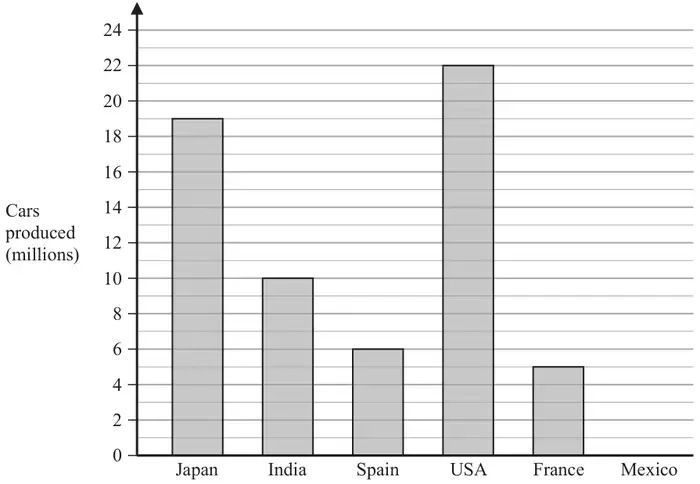
The total number of cars produced in 2017 and 2018 in Mexico was 8 million.
(a) Draw a bar on the bar chart to show this information. (1)
(b) Which of these six countries produced the greatest total number of cars? (1)
(c) Which country produced half as many cars as India? (1)
(d) Work out the difference between the total number of cars produced in Japan and the total number of cars produced in Spain. (1)
| Scheme | Marks |
|---|---|
| Bar drawn of height 8 | B1 |
| (1) |
| Scheme | Marks |
|---|---|
| USA | B1 |
| (1) |
| Scheme | Marks |
|---|---|
| France | B1 |
| (1) |
| Scheme | Marks |
|---|---|
| 13 | B1 |
| (1) | |
| (4 marks) |
Notes
B1: Allow 13 000 000