
Foundation June 2022 Paper 1R Q3
3 The pictogram shows information about the number of loaves of bread sold in a bakery each day from Tuesday to Friday last week.
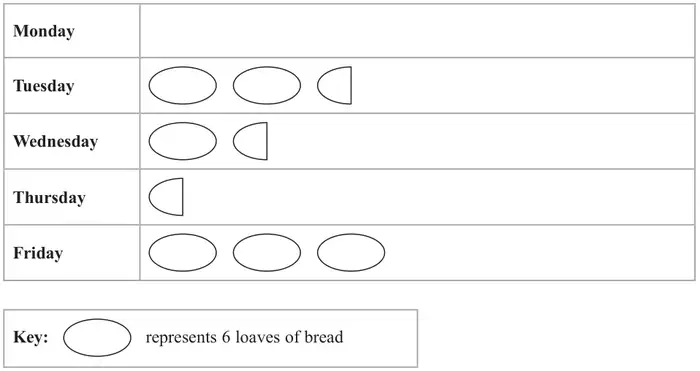
(a) How many loaves of bread were sold on Friday? (1)
The total number of loaves sold in the bakery from Monday to Friday last week was 66
(b)
(i) Work out the number of loaves sold on Monday last week. (2)
(ii) Show this information for Monday on the pictogram. (1)
| Scheme | Marks |
|---|---|
| 18 | B1 |
| (1) |
| Scheme | Marks |
|---|---|
| (i) eg 66 − 15 − 9 − 3 − “18” or 66 − (7.5 × ”6”) or 66 − 45 | M1ft |
| 21 | A1ft |
| (ii) Answer: \(3\frac{1}{2}\) diagrams drawn | B1ft |
| (3) | |
| (4 marks) |
Notes
M1ft: ft their 18 from part (a)
A1ft: ft their 18 from part (a)
eg 66 – 15 – 9 – 3 – their answer to part (a)
B1ft: follow through their 21 from (b)(i)