
Foundation November 2021 Paper 1 Q18
18 On the grid below, draw the graph of \(y = 2x - 2\) for values of \(x\) from \(-2\) to 3 (3)
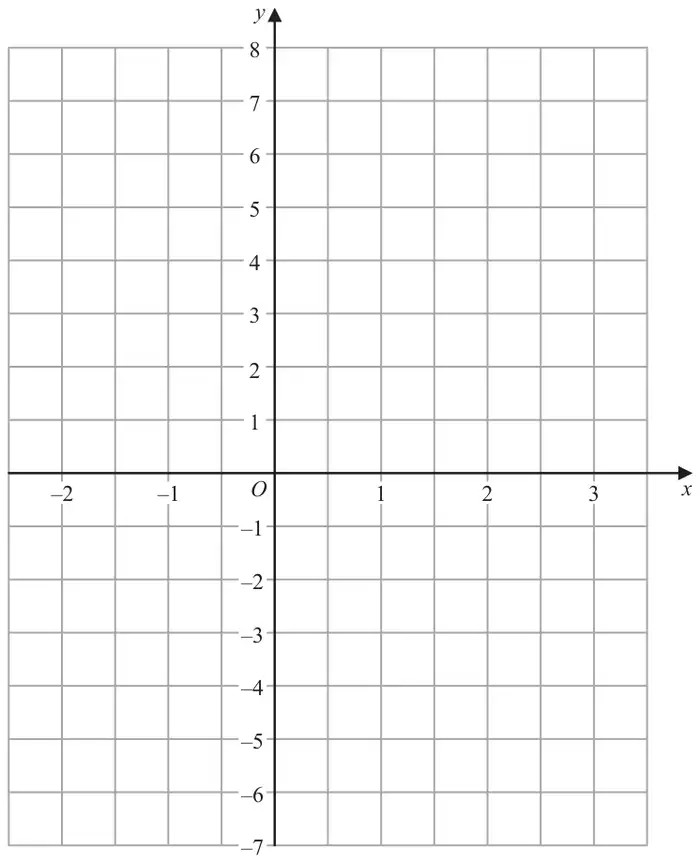
| Answer | Mark | Mark scheme |
|---|---|---|
| Line drawn | B3 | for a correct line drawn between \(x = -2\) and \(x = 3\) |
| (B2 | for a correct straight-line segment through at least 3 of \((-2, -6), (-1, -4), (0, -2), (1, 0), (2, 2), (3, 4)\) or for all of the above points plotted but not joined or for a single line drawn with a positive gradient through \((0, -2)\) and clear intention to use a gradient of 2, eg a line through \((0, -2)\) and \((0.5, 0)\) | |
| (B1 | for at least 2 correct points stated or plotted or a single line drawn with positive gradient through \((0, -2)\) or a single line with gradient 2) |
Additional guidance
Accept freehand line drawn
Ignore any incorrect points
Table of values
| \(x\) | \(-2\) | \(-1\) | 0 | 1 | 2 | 3 |
|---|---|---|---|---|---|---|
| \(y\) | \(-6\) | \(-4\) | \(-2\) | 0 | 2 | 4 |
Coordinates may be in a table or working
Do not accept \(y = -2\) drawn