
Foundation June 2022 Paper 1 Q8
8 The bar chart shows information about the total rainfall each month for four months in a city.
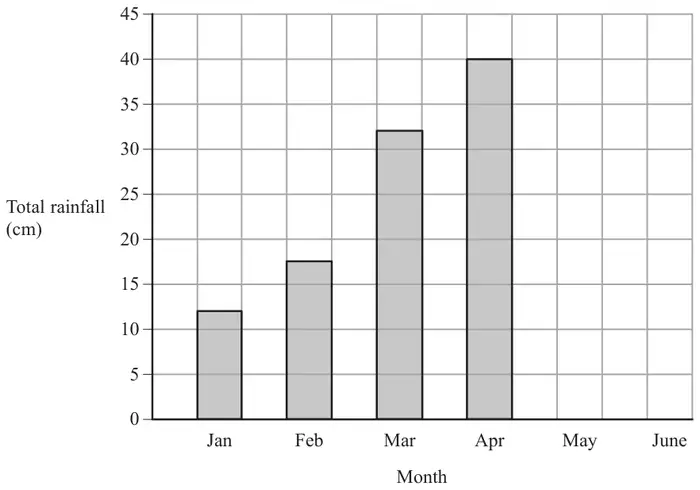
In May, the total rainfall was 35 cm.
In June, the total rainfall was 20 cm.
(a) Use this information to complete the bar chart. (2)
Rupa says,
“In February there was 15.5 cm of rainfall because the bar is half a square above 15”
(b) Explain why Rupa is incorrect. (1)
| Answer | Mark | Mark scheme |
|---|---|---|
| Completed bar chart | B2 | for a fully correct bar chart |
| (B1 | for one bar correct eg May plotted at 35 or June plotted at 20 OR May plotted at 20 and June plotted at 35) |
Additional guidance
Condone bars of unequal width
Condone no gaps or inconsistent gaps
| Answer | Mark | Mark scheme |
|---|---|---|
| Explanation | C1 | Acceptable examples Half a square is worth 2.5 (not 0.5) It goes to 17.5 Halfway between 15 and 20 is not 15.5 It is between 17 and 18 It could/would be 17 or 18 It goes up in 5s (not 1s) Not acceptable examples The bar is in the middle It could/would be 16 (or 19 or 15.6) You can’t have half a cm of rain The answer would be a whole number |