
Foundation June 2017 Paper 1 Q13
13 The diagram shows a tree and a man.
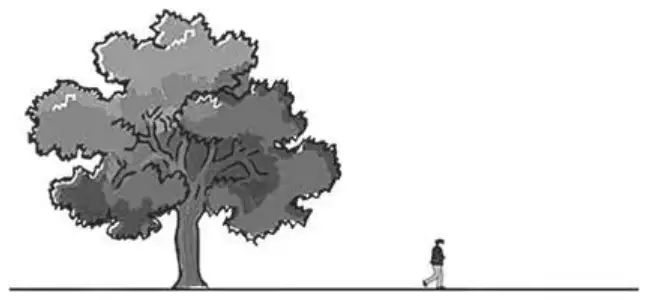
The man is of average height.
The tree and the man are drawn to the same scale.
(a) Write down an estimate for the real height, in metres, of the man. (1)
(b) Find an estimate for the real height, in metres, of the tree. (2)
| Answer | Mark | Notes |
|---|---|---|
| 1.5 to 2 | B1 | in the range 1.5 to 2 |
| Answer | Mark | Notes |
|---|---|---|
| 7.5 to 12 | M1 | for scale factor in the range 5 to 6 |
| A1 | (ft) or for answer in the range 7.5 to 12 |