
AS June 2025 Q2
2. The graph of the probability density function \(\mathrm{f}(x)\) of the continuous uniform random variable \(X\) is shown below.
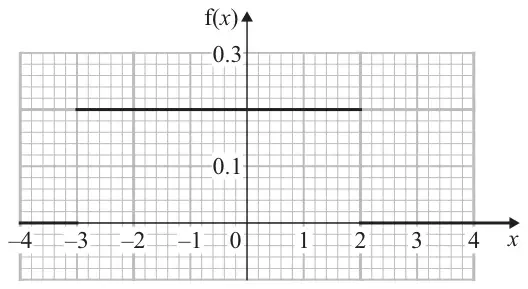
(a) Write down the value of \(\mathrm{P}(X = 1)\) (1)
(b) Find \(\mathrm{E}(X)\) (1)
(c) Find \(\mathrm{Var}(X)\) (1)
(d) Sketch the cumulative distribution function of \(X\) for \(-3 \leqslant x \leqslant 2\)
You should label any points where the sketch touches or crosses the coordinate axes. (3)
You should label any points where the sketch touches or crosses the coordinate axes. (3)
(e) Find \(\mathrm{P}(X^2 \gt 1.96)\) (3)
| Scheme | Marks | AO |
|---|---|---|
| 0 | B1 | 1.1b |
| (1) |
Notes
B1: cao
| Scheme | Marks | AO |
|---|---|---|
| \(\mathrm{E}(X)\left[= \dfrac{-3+2}{2}\right] = -\dfrac{1}{2}\) | B1 | 1.1b |
| (1) |
Notes
B1: o.e.
| Scheme | Marks | AO |
|---|---|---|
| \(\mathrm{Var}(X)\left[= \dfrac{(2-(-3))^2}{12}\right] = \dfrac{25}{12}\) | B1 | 1.1b |
| (1) |
Notes
B1: o.e. (allow awrt 2.08)
| Scheme | Marks | AO |
|---|---|---|
| Sketches straight line with positive gradient | M1 | 2.1 |
| Labels (–3, 0) and ends graph at (2, 1) | A1 | 1.1b |
| Labels (0, 0.6) | A1 | 1.1b |
| (3) |
Notes
M1: Sketching straight line with positive gradient.
A1: Correct label and domain
A1: Correct label on vertical axis
| Scheme | Marks | AO |
|---|---|---|
| \(X \gt 1.4\) or \(X \lt -1.4\) | M1 | 1.1b |
| \(\mathrm{P}(X \gt 1.4) + \mathrm{P}(X \lt -1.4) = \dfrac{2-1.4}{2-(-3)} + \dfrac{-1.4-(-3)}{2-(-3)}\) or \(\dfrac{0.6}{5} + \dfrac{1.6}{5}\) oe | M1 | 3.1a |
| \(\dfrac{11}{25}\) | A1 | 1.1b |
| (3) | ||
| (9 marks) |
Notes
M1: Either correct region
M1: Attempt to find probability using both regions
A1: o.e. e.g. 0.44
NB Stating \(\mathrm{P}(-1.4 \lt X \lt 1.4) = 0.56\) can score M1A1A0