
A2 October 2020 Q4
4.
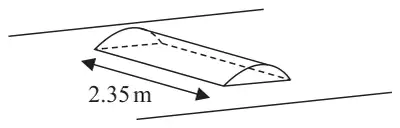
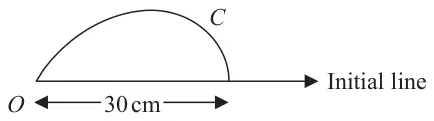
Figure 1 shows a sketch of a design for a road speed bump of width 2.35 metres. The speed bump has a uniform cross-section with vertical ends and its length is 30 cm. A side profile of the speed bump is shown in Figure 2.
The curve \(C\) shown in Figure 2 is modelled by the polar equation
\[r = 30(1 - \theta^2) \qquad 0 \leqslant \theta \leqslant 1\]The units for \(r\) are centimetres and the initial line lies along the road surface, which is assumed to be horizontal.
Once the speed bump has been fixed to the road, the visible surfaces of the speed bump are to be painted.
Determine, in cm2, the area that is to be painted, according to the model.
(10)
| Scheme | Marks | AO |
|---|---|---|
| Complete overall strategy evidenced – requires finding the area of the two sides, and the area of the curved surface via attempt at the arc length first. | M1 | 3.1a |
| Area of each side is \(\displaystyle\int \frac{1}{2}r^2\,\mathrm{d}\theta = 450\int_0^1 (1 - \theta^2)^2\,\mathrm{d}\theta\) | B1 | 1.1b |
| \(\displaystyle= 450\int_0^1 1 - 2\theta^2 + \theta^4\,\mathrm{d}\theta = 450\left[\theta - \frac{2}{3}\theta^3 + \frac{1}{5}\theta^5\right]_0^1\) | M1 | 1.1b |
| \(= 450\left(1 - \dfrac{2}{3} + \dfrac{1}{5}\right) = 240\) (cm2) | A1 | 3.4 |
| \(r^2 + \left(\dfrac{\mathrm{d}r}{\mathrm{d}\theta}\right)^2 = 900\left(1 - 2\theta^2 + \theta^4\right) + \left(30 \times -2\theta\right)^2\) | M1 | 1.1b |
| \(= 900\left(1 + \theta^2\right)^2\) | A1 | 2.2a |
| Length of curve is \(\displaystyle\int_0^1 \sqrt{r^2 + \left(\dfrac{\mathrm{d}r}{\mathrm{d}\theta}\right)^2}\,\mathrm{d}\theta = 30\int_0^1 1 + \theta^2\,\mathrm{d}\theta = 30\left[\theta + \frac{1}{3}\theta^3\right]_0^1\) | M1 | 2.1 |
| \(= 30\left(1 + \dfrac{1}{3} - (0)\right) = 40\) (cm) | A1 | 3.4 |
| Surface area required is \(2 \times \text{“}240\text{”} + \underline{235 \times \text{“}40\text{”}} = \ldots\) | M1 | 1.1b |
| = 9880 cm2 | A1 | 3.2a |
| (10) | ||
| (10 marks) |
Notes
M1: Shows a complete strategy for finding the required surface area – must include both sides, and attempt at area of curved surface using arc length using the correct formula.
B1: Uses polar area formula for at least one of the two sides. May use \(2 \times \displaystyle\int \tfrac{1}{2}r^2\,\mathrm{d}\theta\), but should be clear they are finding area of both sides. (Limits not needed for this mark.)
M1: Expands \(r^2\) and integrates, powers to raise by 1.
A1: Applies limits and finds the area of one (or both) sides. 240 cm2 for one sides, or 480 cm2 for both. Look to see if they double when combining to see if they have one or two sides.
M1: Attempts \(r^2 + \left(\dfrac{\mathrm{d}r}{\mathrm{d}\theta}\right)^2\) with correct differentiation. May be errors in squaring.
A1: Correct factorised expression, which may be implied by later work when they need to square root.
M1: Applies the arc length formula to their expression, must be a valid attempt to square root. (Limits not needed.)
A1: Applies the limits to the integral to obtain correct arc length.
M1: Uses area of curved surface is arc length \(\times\) width of bump, with correct units used (not 2.35 and 40 unless they recover before adding) and adds the areas of the sides. Allow even if the attempt at the arc length came from incorrect application of the formula.
A1: cao 9880 cm2