
A2 June 2022 Q3
3. The table below shows the transport options, usual travel times, possible delay times and corresponding probabilities of delay for a journey. All times are in minutes.
| Transport option | Usual travel time | Possible delay time | Probability of delay |
|---|---|---|---|
| Car | 52 | 10 | 0.10 |
| 25 | 0.02 | ||
| Train | 45 | 15 | 0.05 |
| 25 | 0.03 | ||
| Coach | 55 | 5 | 0.05 |
| 15 | 0.01 |
| Scheme | Marks | AO |
|---|---|---|
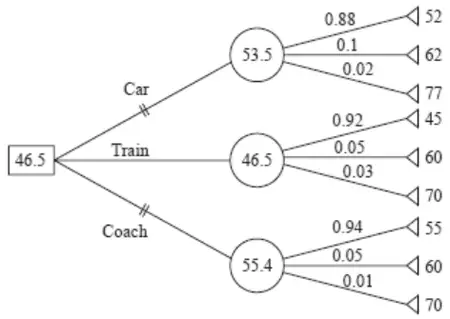 | M1 A1 M1 M1 A1 | 3.3 1.1b 3.4 3.4 1.1b |
| (5) |
Notes
M1: tree diagram with at least nine end pay-offs, one decision node and at least three chance nodes used correctly
A1: correct structure of tree diagram with each arc labelled correctly (including probabilities)
M1: at least three end-pay offs consistent with their stated probabilities (eg time 52 with probability 0.88); all nine attempted
M1: chance nodes attempted with their probabilities. Must be filled in on their diagram.
A1: cao for chance and decision nodes completed correctly
| Scheme | Marks | AO |
|---|---|---|
| Minimum expected travel time is 46.5 minutes Transport option is Train | B1ft B1 | 3.4 2.2a |
| (2) | ||
| (7 marks) |
Notes
B1ft: correct travel time from their completed tree diagram (dependent on all method marks earned in (a))
B1: deduction of correct transport option (dependent on all method marks earned in (a)) including double line through inferior options in (a) (condone cross or single line here)