
June 2025 Paper 1 Q1
1.
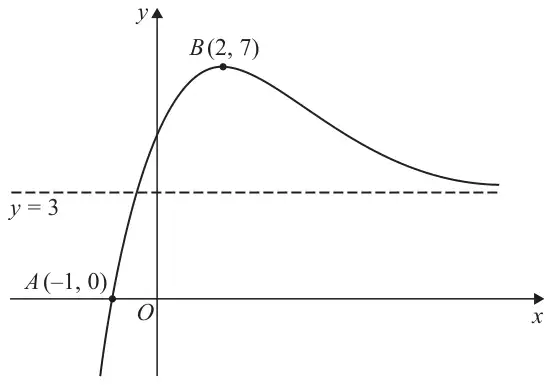
Figure 1 shows a curve with equation \(y = \mathrm{f}(x)\)
The curve
- passes through the point \(A(-1,\ 0)\)
- has a maximum turning point at \(B(2,\ 7)\)
- has a horizontal asymptote with equation \(y = 3\)
On separate diagrams, sketch the curve with equation
On each diagram, show clearly the coordinates of the points to which \(A\) and \(B\) are transformed and the equation of the asymptote.
| Scheme | Marks | AO |
|---|---|---|
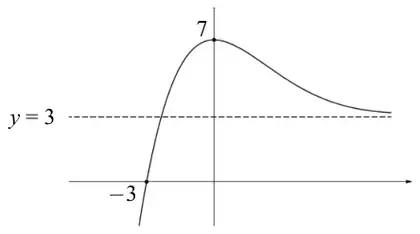
| Shape for a horizontal translation | B1 | 1.1b |
| Two of \((0,7)\), \((-3,0)\) and \(y = 3\) correctly labelled. | B1 | 1.1b |
| All three of \((0,7)\), \((-3,0)\) and \(y = 3\) correctly labelled. | dB1 | 1.1b |
| (3) |
Notes
For both parts of question 1:
- There must be a sketch to score any marks.
- Condone the coordinates of the turning point or intercepts having missing brackets e.g. 0, 7 or (0, 7
- Asymptotes must be labelled as an equation i.e. not just a value on the \(y\)-axis and must correspond to the sketch.
- The asymptote does not need to be drawn as a dotted line but the curve must be asymptotic to the correct line.
- Points/asymptote equations may be stated away from the sketch but must be fully correct and correspond to the sketch
- If there is ambiguity, the sketch takes precedence.
- Mark positively regarding both sketches and mark the candidate’s intention regarding the shape, position of the turning point, and behaviour at the asymptote so that the curves do not need to be “perfectly” drawn
- Labelling of points as e.g. \(A\) and \(B\) can be ignored.
- Attempts to do their sketches on Figure 1 should be sent to review.
(i) Notes
B1: Requires the shape for a horizontal translation in either direction.
There should be no change in the \(y\) coordinate for any point and no change in the equation of the asymptote if drawn.
Evidence can be obtained e.g. by the position of the maximum or the \(x\) intercept.
Do not be concerned if they are contradictory but it should not just be the original curve.
B1: Two of \((0,\ 7)\), \((-3,\ 0)\) and \(y = 3\) correctly labelled.
The maximum does not necessarily have to correspond with the (0, 7) for this mark.
Allow 7 and/or \(-3\) marked in the correct place and condone \((7,\ 0)\) and/or \((0,\ -3)\) as long as they are in the correct place.
The curve must not clearly cross the asymptote if awarding for this condition.
dB1: All three of \((0,7)\), \((-3,0)\) and \(y = 3\) correctly labelled.
The maximum should correspond with the (0, 7) for this mark but mark positively if it is not absolutely clear – you may have to use your own judgement.
Allow 7 and/or \(-3\) marked in the correct place and condone \((7,\ 0)\) and/or \((0,\ -3)\) as long as they are in the correct place.
The curve must not clearly cross the asymptote.
Must follow both previous B1’s.
| Scheme | Marks | AO |
|---|---|---|
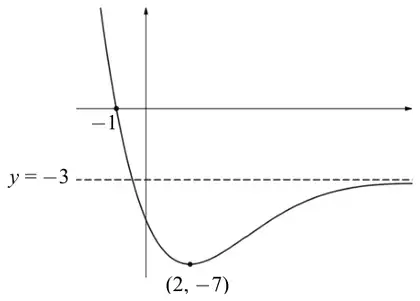
| Shape for a reflection in \(x\)-axis | B1 | 1.1b |
| Two of \((2,\ -7)\), \((-1,0)\) and \(y = -3\) correctly labelled. | B1 | 1.1b |
| All three of \((2,\ -7)\), \((-1,0)\) and \(y = -3\) correctly labelled. | dB1 | 1.1b |
| (3) | ||
| (6 marks) |
Notes
For both parts of question 1:
- There must be a sketch to score any marks.
- Condone the coordinates of the turning point or intercepts having missing brackets e.g. 0, 7 or (0, 7
- Asymptotes must be labelled as an equation i.e. not just a value on the \(y\)-axis and must correspond to the sketch.
- The asymptote does not need to be drawn as a dotted line but the curve must be asymptotic to the correct line.
- Points/asymptote equations may be stated away from the sketch but must be fully correct and correspond to the sketch
- If there is ambiguity, the sketch takes precedence.
- Mark positively regarding both sketches and mark the candidate’s intention regarding the shape, position of the turning point, and behaviour at the asymptote so that the curves do not need to be “perfectly” drawn
- Labelling of points as e.g. \(A\) and \(B\) can be ignored.
- Attempts to do their sketches on Figure 1 should be sent to review.
(ii) Notes
B1: Requires the shape for a reflection in the \(x\)-axis.
The curve must be in quadrants 2, 3 and 4 only.
There should be a minimum in quadrant 4
The coordinates of the \(x\) intercept and the minimum and the position of the asymptote can be ignored for this mark.
B1: Two of \((2,\ -7)\), \((-1,0)\) and \(y = -3\) correctly labelled where the \((2,\ -7)\) is a minimum.
Allow \(-1\) marked in the correct place and condone \((0,\ -1)\) as long as it is the correct place.
Allow the \((2,\ -7)\) to be indicated by the labels 2 and \(-7\) on the appropriate axes
Allow the curve to be asymptotic to \(y = -3\) from above.
The curve must not clearly cross the asymptote if awarding for this condition.
dB1: All three of \((2,\ -7)\), \((-1,\ 0)\) and \(y = -3\) correctly labelled where the \((2,\ -7)\) is a minimum.
Allow \(-1\) marked in the correct place and condone \((0,\ -1)\) as long as it is the correct place.
Allow the \((2,\ -7)\) to be indicated by the labels 2 and \(-7\) on the appropriate axes.
The curve must be asymptotic to \(y = -3\) from below.
The curve must not clearly cross the asymptote.
Must follow both previous B1’s.