
October 2020 Paper 3 Q3
3. Each member of a group of 27 people was timed when completing a puzzle.
The time taken, \(x\) minutes, for each member of the group was recorded.
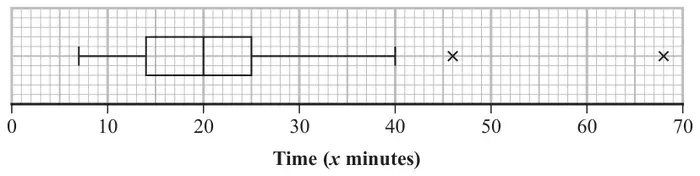
These times are summarised in the following box and whisker plot.
For these 27 people \(\sum x = 607.5\) and \(\sum x^2 = 17\,623.25\)
Taruni defines an outlier as a value more than 3 standard deviations above the mean.
Adam and Beth also completed the puzzle in \(a\) minutes and \(b\) minutes respectively, where \(a \gt b\).
When their times are included with the data of the other 27 people
- the median time increases
- the mean time does not change
| Scheme | Marks | AO |
|---|---|---|
| [\(68 - 7 =\)] 61 (only) | B1 | 1.1b |
| (1) |
Notes
B1: for correctly interpreting the box plot to find the range (more than 1 answer is B0)
| Scheme | Marks | AO |
|---|---|---|
| [\(25 - 14\)] = 11 | B1 | 1.1b |
| (1) |
Notes
B1: for correct understanding of IQR and answer of 11
| Scheme | Marks | AO |
|---|---|---|
| \(\left[\mu \text{ or } \bar{x} = \dfrac{607.5}{27} =\right]\) = 22.5 | B1 | 1.1b |
| (1) |
Notes
B1: for 22.5 only (or exact equivalent such as \(\frac{45}{2}\)). Allow 22 mins and 30 secs.
| Scheme | Marks | AO |
|---|---|---|
| \(\sigma = \sqrt{\dfrac{17\,623.25}{27} - \text{``}22.5\text{''}^2}\) or \(\sqrt{146.4629\ldots}\) | M1 | 1.1b |
| = 12.10218… awrt 12.1 | A1 | 1.1b |
| (2) |
Notes
M1: for a correct expression including square root. Allow \(\sqrt{146}\) or better. Ft their mean
A1: for awrt 12.1 NB Allow use of \(s = 12.3327\ldots\) or awrt 12.3
| Scheme | Marks | AO |
|---|---|---|
| \(\mu + 3\sigma = \text{``}22.5\text{''} + 3 \times \text{``}12.1\ldots\text{''} = \text{awrt } 59\) so only one outlier | B1ft | 1.1b |
| (1) |
Notes
B1ft: for a correct calculation or value based on their \(\mu\) and \(\sigma\) and compatible conclusion
| Scheme | Marks | AO |
|---|---|---|
| Median increases implies that both values must be > 20 | M1 | 3.1b |
| Mean is the same means that \(a + b = 45\) | M1 | 1.1b |
| So possible values are: e.g. \(b = 21\) and \(a = 24\) (o.e.) | A1 | 2.2b |
| (3) |
Notes
1st M1: Correct start to the problem and a correct statement about the values based on median
Allow if their final two values are both >20
2nd M1: for a correct explanation leading to equation \(a + b = 45\) (o.e. e.g. equidistant from mean)
Allow if their final two values sum to 45
A1: for a correct pair of values (both > 20 with a sum of 45) and at least some attempt to explain how their values satisfy at least one of the conditions (both > 20 or \(a + b = 45\)).
Ignore \(a =\) or \(b =\) labels
NB: The values for \(a\) and \(b\) do not need to be integers.
| Scheme | Marks | AO |
|---|---|---|
| Both values will be less than 1 standard deviation from the mean and so the standard deviation of all 29 values will be smaller | B1 | 2.4 |
| (1) | ||
| (10 marks) |
Notes
B1: for a correct explanation.
Must mention that both values are less than 1 sd (ft their answer to (d)) from the mean