
Higher November 2024 Paper 2 Q21
21 The graph represents the velocity of a ball as it rolls along the ground.
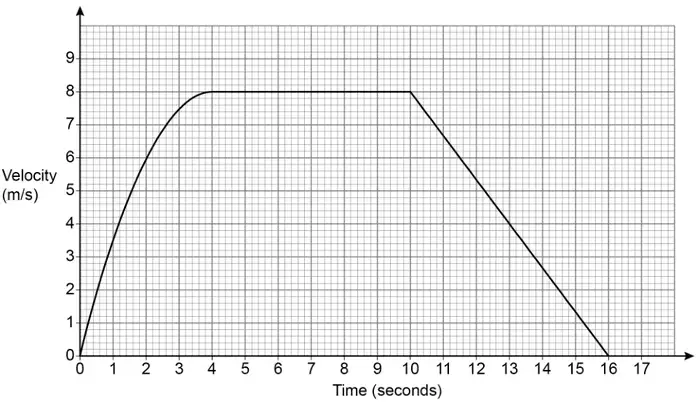
(a) Work out an estimate for the acceleration of the ball, in m/s\(^2\), after 2 seconds.
You must show your working. [2 marks]
(b) Work out an estimate for the total distance covered by the ball. [3 marks]
(c) Is your estimate from part (b) an overestimate or underestimate?
Tick a box.
- Overestimate
- Underestimate
Give a reason for your answer. [1 mark]
| Answer | Mark | Comments |
|---|---|---|
| Draws a tangent at 2 seconds and [1.5, 2.5] | B2 | B1 draws tangent at 2 seconds |
| Answer | Mark | Comments |
|---|---|---|
| [88, 95] | B3 | B2 (area under curve =) [16, 22] or (area under horizontal =) 48 and (area under diagonal =) 24 implied by 72 B1 (area under horizontal =) 48 or (area under diagonal =) 24 |
Additional guidance
For B2 and B1 areas may be seen on the diagram
| Answer | Mark | Comments |
|---|---|---|
| Underestimate and valid reason involving area under the graph | B1ft | ft their area in (b) |