
Higher November 2022 Paper 2 Q6
6 The composite bar chart shows information about the percentage of drinks sold by a café in 2007 and 2019
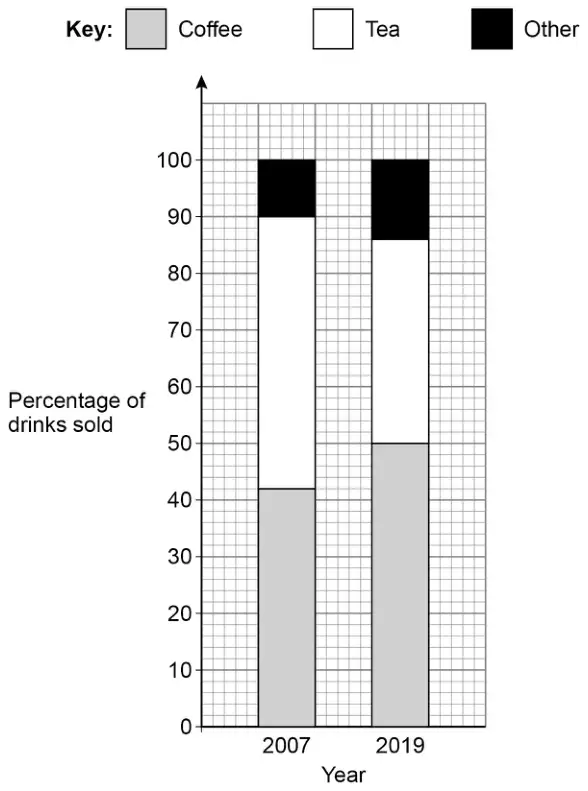
(a) In 2007 the café sold a total of 24 000 drinks.
How many more teas than coffees were sold? [2 marks]
(b) Were more coffees sold at the café in 2019 than in 2007?
Tick a box.
- Yes
- No
- Cannot tell
Give a reason for your answer. [1 mark]
| Answer | Mark | Comments |
|---|---|---|
| \(\dfrac{90 - 42}{100} \times 24\,000\) or \(\dfrac{48}{100} \times 24\,000\) or 11 520 or \(\dfrac{42}{100} \times 24\,000\) or 10 080 or \(\dfrac{48 - 42}{100} \times 24\,000\) or 6 and 48 and 42 seen | M1 | oe |
| 1440 | A1 | SC1 1920 or answer with digits 144 |
Additional guidance
| Up to M1 may be awarded for correct work with no answer, or incorrect answer, even if this is seen amongst multiple attempts | |
| Build-up to 48% or 42% must be correct or full method must be shown | |
| eg only \(48\% \times 24\,000\) with no or incorrect evaluation | M0 |
| Answer | Mark | Comments |
|---|---|---|
| Ticks Cannot tell and valid reason | B1 | eg ticks Cannot tell and We don’t know the number sold (in 2019) |
Additional guidance
| Ignore calculations using percentages from the bar chart | |
| Allow any unambiguous indication of Cannot tell with a valid reason | |
| Ticks Cannot tell and They might have sold fewer drinks (in 2019) | B1 |
| Ticks Cannot tell and It (only) gives percentages | B1 |
| Ticks Cannot tell and It doesn’t tell you how many coffees were sold | B1 |
| Ticks Cannot tell and Don’t have enough information | B1 |
| Ticks Cannot tell and Both bars the same height | B0 |
| Ticks Yes or ticks No | B0 |