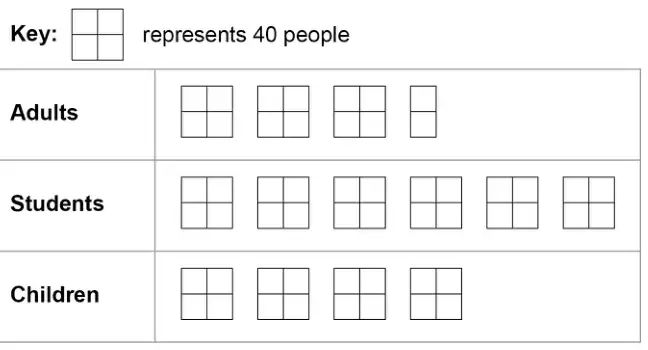
8 Here is some information, by ticket type, about the number of people visiting a cinema one week.
(a) How many children visited the cinema? [1 mark]
(b) How many more students than adults visited the cinema? [2 marks]
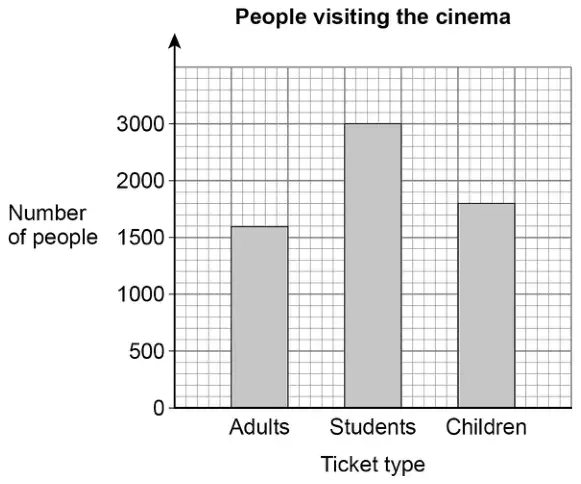
(c) A bar chart is drawn to show the number of people visiting the cinema one month.
Ticket type
Number of people
Adults
1600
Students
3000
Children
1800
Give one criticism of the bar chart. [1 mark]
Mark scheme (a)
Answer
Mark
Comments
160
B1
Additional guidance
If answer line blank, check diagram
Accept 160 people but not adults or students
Accept 160 out of 540
B1
Do not accept \(\dfrac{160}{540}\)
B0
Mark scheme (b)
Answer
Mark
Comments
(difference =) \(6 - 3.5\) or 2.5 or (working in small boxes) \(24 - 14\) or (S) \(6 \times 40\) or \(24 \times 10\) or 240 or (A) \(3.5 \times 40\) or \(14 \times 10\) or 140 or \(40 + 40 + 20\)
M1
oe
100
A1
Additional guidance
Check diagram for working
Mark scheme (c)
Answer
Mark
Comments
Valid criticism
B1
eg the scale on the vertical axis is incorrect eg 2500 is missing
Additional guidance
Middle bar should be taller / is too short Students bar is wrong Number of people hasn’t been plotted correctly
3000 should be 2500 They missed out (or didn’t label) 2500 3000 is wrong 3000 is too big a gap (implies 1000 people instead of 500) 3000 is too small a gap (implies 500 space for 1000) Arrow/circle on diagram showing the jump from 2000 to 3000 but no words From 2000 to 3000 it went up in 200 (refers to little squares) 3000 should be at the top/end (of the grid)
Changes scale Scale is wrong Numbers on the side are incorrect Lacks consistency on the way up Number of people does not go up in equal amounts Uneven/unequal number of people Should go up in 500s It goes up by 1000 Was going up by 500 then went up by 1000 Starts going up in hundreds then goes up in 200s
B1
The gap is too big Space between bars Spaces too big between numbers Numbers on the \(y\) axis are not in order (they are numerically in order) There is a gap/space on the (vertical) axis Should go up in even numbers (they are going up in even numbers) Starts (going up) in hundreds then goes up in thousands