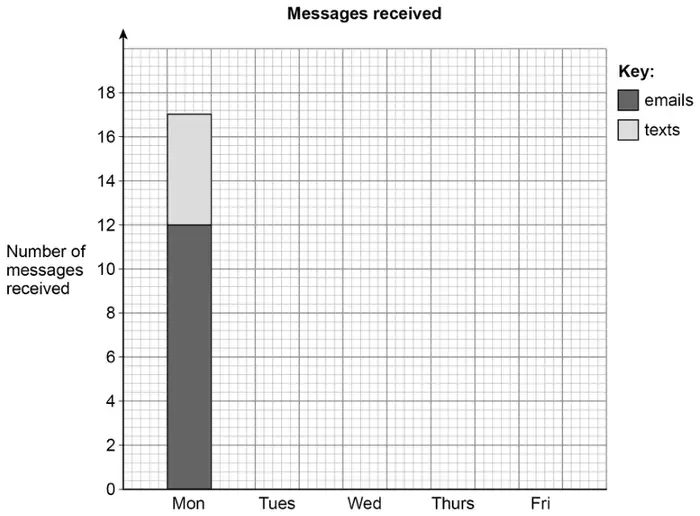
9 The table shows the number of messages Sam received each day for five days.
Messages
Number of emails
Number of texts
Monday
12
5
Tuesday
8
6
Wednesday
10
3
Thursday
6
6
Friday
12
4
(a) Sam draws a composite bar chart to represent the data.
He has drawn the bar for Monday.
Complete the chart. [2 marks]
(b) In total, what fraction of the messages were emails?
Give your answer in its simplest form. [3 marks]
Mark scheme (a)
Answer
Mark
Comments
All composite bars with correct widths and heights as Tuesday 8 and 6 Wednesday 10 and 3 Thursday 6 and 6 Friday 12 and 4
B2
B1 one composite bar correct or all four email sections correct at the bottom of composite bars or all four text sections correct at the top of composite bars or four bars with total heights 14, 13, 12 and 16 (no or incorrect divisions) or widths different but all four composite bars correct
Additional guidance
Bars drawn freehand with clear intention of correct widths and heights
B2
Mark intention for heights but Wednesday height must be [6.4, 6.6] cm
Condone incorrect shading or lack of shading
Mark scheme (b)
Answer
Mark
Comments
12 + 8 + 10 + 6 + 12 or 48 or 5 + 6 + 3 + 6 + 4 or 24 or 12 + 8 + 10 + 6 + 12 + 5 + 6 + 3 + 6 + 4 or 72
M1
may be seen near table
addition may be implied by a total at the bottom of a column
\(\dfrac{48}{72}\)
A1
oe fraction
\(\dfrac{2}{3}\)
A1ft
ft M1A0 with their fraction \(< 1\) seen, if it can be simplified and it is fully simplified