
A2 June 2025 Paper 2 Q8
8 The function \(\mathrm{f}\) is defined by
\[\mathrm{f}(x) = x^3 + x^2 - 12x \qquad (x \in \mathbb{R})\]Figure 1 shows the graph of \(y = \mathrm{f}(x)\)
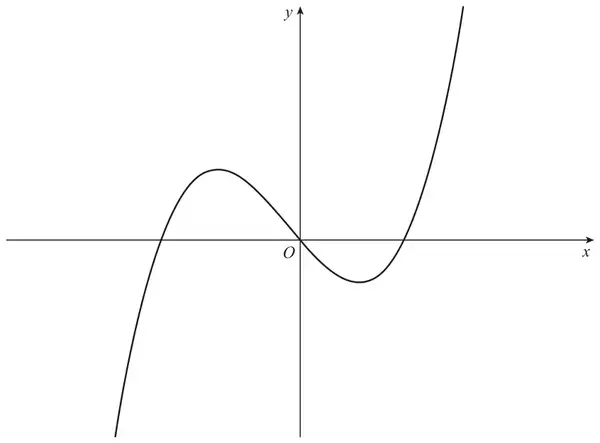
(a) The graph of \(y = \mathrm{f}(x)\) is transformed by a stretch, scale factor 2, parallel to the \(x\)-axis with the \(y\)-axis fixed, to give the graph of \(y = \mathrm{g}(x)\)
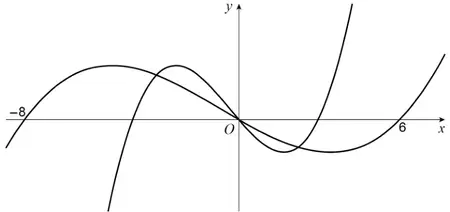
On Figure 1, sketch the graph of \(y = \mathrm{g}(x)\), showing the values of \(x\) where the graph crosses the \(x\)-axis. [3 marks]
(b) Find the set of values of \(x\) such that the conditions \(\mathrm{f}(x) \gt 0\) and \(\mathrm{g}(x) \lt 0\) are both satisfied. [2 marks]
| Scheme | Marks | AO |
|---|---|---|
| Draws a cubic graph of the correct shape. Condone any horizontal stretch. | B1 | 1.1b |
| Draws a cubic graph that crosses \(x\)-axis at \(-8\), 0 and 6 Accept no indication of \(x = 0\) at the origin. | B1 | 1.1b |
| Shows local maximum and minimum points which are approximately the same height as in the original graph. | B1 | 1.1b |
| (3) |
Typical solution
| Scheme | Marks | AO |
|---|---|---|
| Obtains a set of values of the form \(\{x : a \lt x \lt 2a\}\) or \(\{x : 2a \lt x \lt a\}\) Condone non-strict inequality. Condone set notation not used. | M1 | 2.2a |
| Obtains \(3 \lt x \lt 6\) Condone set notation not used. | A1 | 2.2a |
| (2) | ||
| (5 marks) |