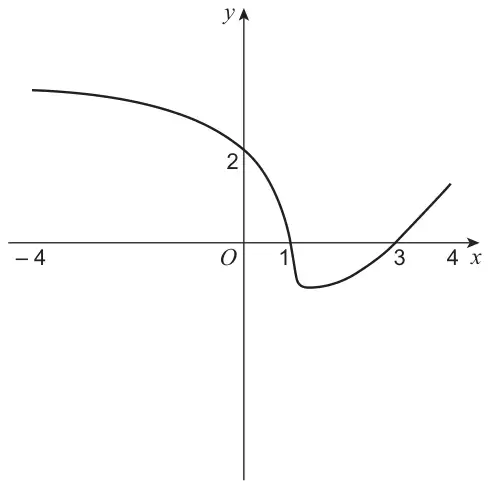
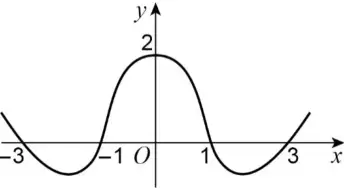
7 The diagram below shows the graph of \(y = \mathrm{f}(x)\) \((-4 \leqslant x \leqslant 4)\)
The graph meets the \(x\)-axis at \(x = 1\) and \(x = 3\)
The graph meets the \(y\)-axis at \(y = 2\)
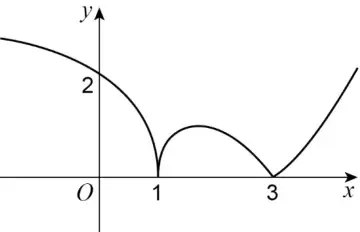
(a) Sketch the graph of \(y = |\mathrm{f}(x)|\) on the axes below.
Show any axis intercepts. [2 marks]
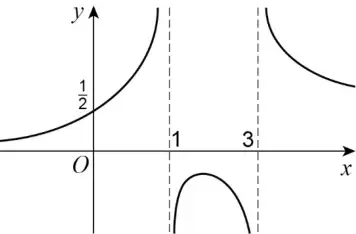
(b) Sketch the graph of \(y = \dfrac{1}{\mathrm{f}(x)}\) on the axes below.
Show any axis intercepts and asymptotes. [3 marks]
(c) Sketch the graph of \(y = \mathrm{f}(|x|)\) on the axes below.
Show any axis intercepts. [2 marks]
Mark scheme (a)
Scheme
Marks
AO
Reflects the part of the graph which lies below the \(x\)-axis in the \(x\)-axis Condone any continuous curve
M1
3.1a
Obtains the correct graph including all the intercepts
A1
1.1b
(2)
Typical solution
Mark scheme (b)
Scheme
Marks
AO
Shows correct asymptotes
B1
2.2a
Draws graph of correct shape: 1) Curve above the \(x\)-axis to left of \(x = 1\) and an increasing function 2) Curve below \(x\)-axis between \(x = 1\) and \(x = 3\), with a local maximum 3) Curve above the \(x\)-axis to right of \(x = 3\) and a decreasing function Condone one wrong asymptote
M1
3.1a
Obtains correct graph including intercept (ignore other details such as the \(y\)-values for minimum and maximum values of \(x\)) Condone one wrong asymptote
A1F
1.1b
(3)
Typical solution
Mark scheme (c)
Scheme
Marks
AO
Sketches and reflects the part of the graph which lies to the right of the \(y\)-axis in the \(y\)-axis Condone reasonable attempt at the graph being symmetric about the \(y\)-axis
M1
1.1a
Correctly shows all the intercepts on their sketch