
June 2021 Paper 2 Q13
13 The diagram below shows the probability distribution for a discrete random variable \(Y\).
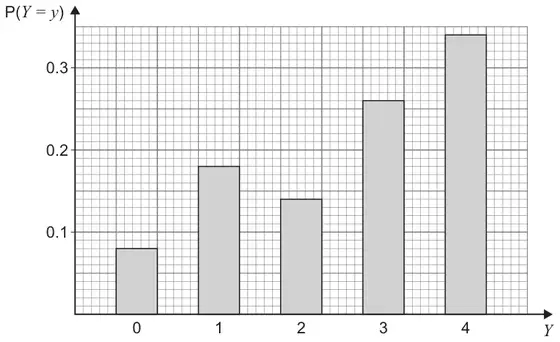
Find \(\mathrm{P}(0 \lt Y \leqslant 3)\).
Circle your answer. [1 mark]
- 0.40
- 0.42
- 0.58
- 0.66
| Scheme | Marks | AO |
|---|---|---|
| Circles the correct answer | B1 | 1.1b |
| (1 mark) |
Typical solution
0.58