
June 2020 Paper 2 Q12
12 A student plots the scatter diagram below showing the mass in kilograms against the CO2 emissions in grams per kilogram for a sample of cars in the Large Data Set.
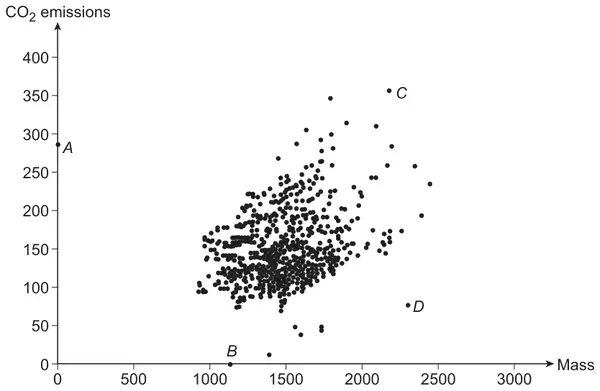
Their teacher tells them to remove an error to clean the data.
Identify the data point which should be removed.
Circle your answer below. [1 mark]
- \(A\)
- \(B\)
- \(C\)
- \(D\)
| Scheme | Marks | AO |
|---|---|---|
| Circles correct answer | B1 | 2.2a |
| (1 mark) |
Typical solution
A