
June 2018 Paper 2 Q18
18 Jennie is a piano teacher who teaches nine pupils.
She records how many hours per week they practice the piano along with their most recent practical exam score.
| Student | Practice (hours per week) | Practical exam score (out of 100) |
|---|---|---|
| Donovan | 50 | 64 |
| Vazquez | 6 | 71 |
| Higgins | 3 | 55 |
| Begum | 2.5 | 47 |
| Collins | 1 | 80 |
| Coldbridge | 4 | 61 |
| Nedbalek | 4.5 | 65 |
| Carter | 8 | 83 |
| White | 11 | 92 |
She plots a scatter diagram of this data, as shown below.
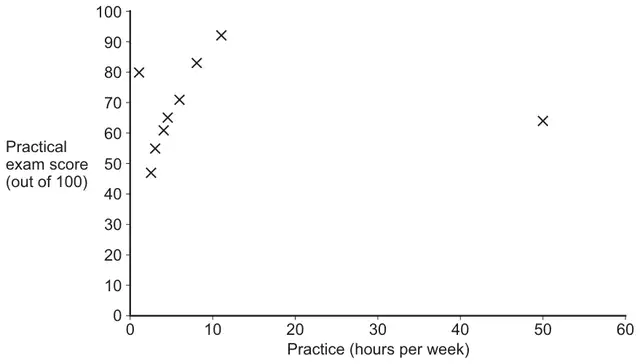
(a) Identify two possible outliers by name, giving a possible explanation for the position on the scatter diagram of each outlier. [4 marks]
(b) Jennie discards the two outliers.
(i) Describe the correlation shown by the scatter diagram for the remaining points. [1 mark]
(ii) Interpret this correlation in the context of the question. [1 mark]
| Scheme | Marks | AO |
|---|---|---|
| Identifies Donovan | B1 | 1.2 |
Infers a reason for Donovan
| E1 | 2.2b |
| Identifies Collins | B1 | 1.2 |
Infers a reason for Collins
| E1 | 2.2b |
| (4) |
Typical solution
First Outlier Donovan
Reason
A data entry error has been made (should be 5 not 50)
Second outlier Collins
Reason
Naturally very able student.
| Scheme | Marks | AO |
|---|---|---|
| (i) Describes correlation correctly, at least strong positive. Accept non – linear correlation, but do not accept numerical value to indicate strength | B1 | 2.5 |
| (1) | ||
| (ii) Interprets correlation in context (as given in typical solution OE) Do not accept the better you do in the exam the more you practised | E1 | 3.2a |
| (1) | ||
| (6 marks) |
Typical solution
(i)
Strong Positive Correlation
(ii)
Students who complete more practice perform better in the exam