
June 2019 Paper 3 Q10
10 Which of the options below best describes the correlation shown in the diagram below?
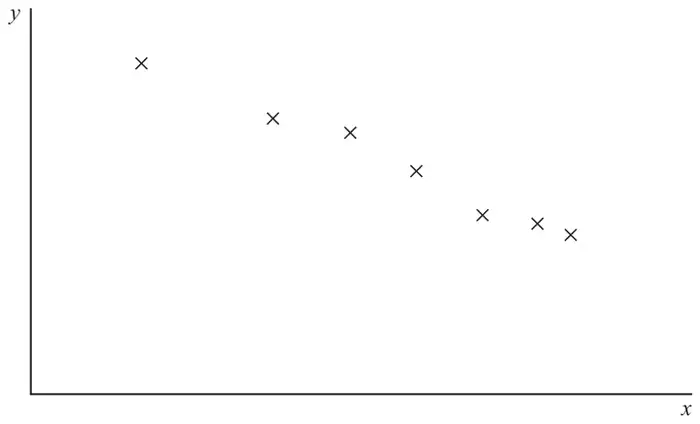
Tick (✓) one box. [1 mark]
- moderate positive
- strong positive
- moderate negative
- strong negative
| Scheme | Marks | AO |
|---|---|---|
| Ticks correct box | B1 | 1.2 |
| (1 mark) |
Typical solution
Strong negative