
Numeracy Higher November 2018 Unit 2 Q9
9. A train manufacturer has developed a new braking system.
The velocity-time graph shows the velocity of a train from when the new brakes are applied until it comes to rest.
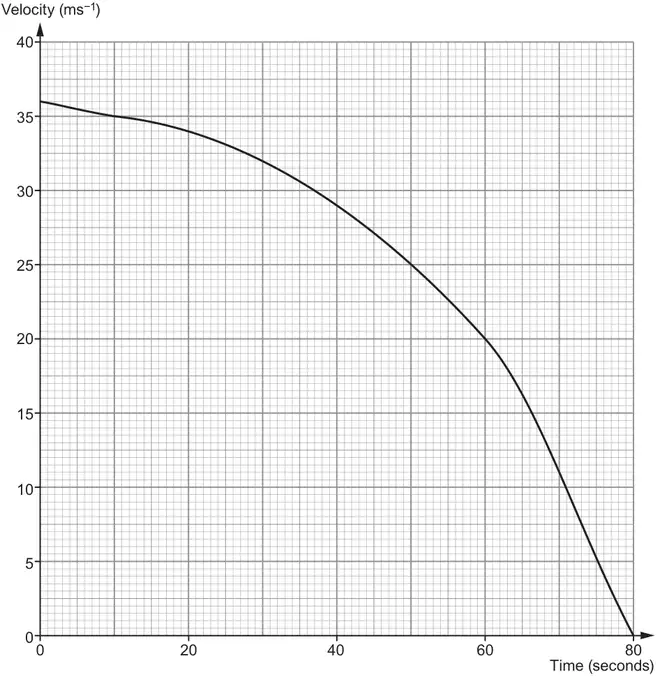
(a) Estimate the train’s deceleration at time 60 seconds. [3]
(b)
(i) Calculate an estimate of the distance travelled by the train from the instant the brakes are applied until it comes to rest.
You must use exactly 4 strips of equal width. [3]
You must use exactly 4 strips of equal width. [3]
(ii) Explain how you could use the graph to gain a more accurate estimate of the distance travelled. [1]
| Scheme | Marks | Comments |
|---|---|---|
| Tangent drawn at 60 seconds Idea of difference in y ÷ difference in x | M1 m1 | Allow one error in counting squares or in reading the scale for m1 only |
| Correct gradient from difference in y ÷ difference in x | A1 | Accept the gradient as a proper fraction or decimal or percentage Allow negative values Mark final answer |
| Scheme | Marks | Comments |
|---|---|---|
| (i) \(\dfrac{1}{2}\) × 20 × (36 + 0 + 2(34 + 29 + 20)) OR \(\dfrac{1}{2}\) × 20 × (36 + 68 + 58 + 40) | M2 | Award M1 if only one reading incorrect |
| = 2020 (m) | A1 | FT from M1 |
| (ii) Explanation e.g. ‘Increase the number of strips’, or ‘Use strips of smaller width’ | E1 |
Alternative
Alternative method: (b)(i)
| Scheme | Marks | Comments |
|---|---|---|
| \(\dfrac{36 + 34}{2}\) × 20 + \(\dfrac{34 + 29}{2}\) × 20 + \(\dfrac{29 + 20}{2}\) × 20 + \(\dfrac{20 + 0}{2}\) × 20 | M2 | (= 700 + 630 + 490 + 200) Each area may be seen as the sum of the area of a rectangle and triangle M1 for the sum of 4 areas with at least 2 correct |
| = 2020 (m) | A1 | FT from M1 If no marks awarded and 8 strips used, SC2 for summing the areas (355+345+330+305+270+225+155+55) leading to an answer of 2040 (m) OR SC1 for summing the areas (355+345+330+305+270+225+155+55) but not arriving at an answer of 2040 (m) or SC1 for the sum of 8 areas with any 6 correct |