
Numeracy Higher November 2017 Unit 1 Q7
7. The times taken by a group of pupils to answer a numeracy question were recorded.
The histogram below shows some of the results.
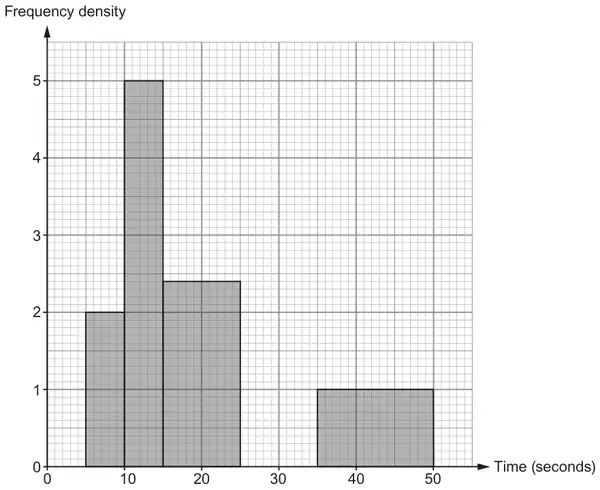
The remaining 16 pupils took between 25 and 35 seconds to answer the question.
Complete the histogram. [1]
What is the greatest possible range of times taken by the pupils to answer the question?
Circle your answer. [1]
50 seconds 4 seconds 40 seconds 45 seconds 35 seconds
Calculate the total number of pupils that were in the group. [2]
Gareth was one of the pupils in the group.
He says,
“The time I took to answer the question was 18 seconds. This means I was in the fastest 50% of the pupils.”
Explain how Gareth’s statement could be true.
You must use calculations to justify your answer. [3]
Explain how Gareth’s statement could be false. [1]
| Scheme | Marks | Comments |
|---|---|---|
| Correct bar of height 1·6 | B1 |
| Scheme | Marks | Comments |
|---|---|---|
| 45 (seconds) | B1 |
| Scheme | Marks | Comments |
|---|---|---|
| (5×2)+(5×5)+(10×2·4)+16+(15×1) or 10 + 25 + 24 + 16 + 15 | M1 | Allow M1 for any 3 correct including the use of 16 |
| = 90 | A1 | CAO |
| Scheme | Marks | Comments |
|---|---|---|
| (i) 10 + 25 + (3/10 × 24) | M1 | FT 'their 24' |
| = 42(·2) | A1 | CAO |
| Statement e.g. ‘This is less than 45 which is 50%’ or ‘Gareth came about 42nd which is in the fastest 50%’ | A1 | FT 'their 90' and FT from M1A0 Alternative methods: M1 for 2·4x = 10 OR 2·4x = 14 FT ‘their 90’ A1 for (50% mark =) 19(·1666..) (sec) A1 for statement e.g. ‘Gareth’s time is in the fastest 50%’ OR M1 for 90/2 – 10 – 25 (= 10 pupils) FT ‘their 90’ A2 for a statement e.g. ‘If fewer than 10 (pupils) took between 15 and 18 seconds (then it would be true)’, or ‘Gareth needs to be in the first 10 (pupils) in the 15 to 25 group’, or ‘Gareth could be one of the fastest 10 in the 15 to 25 group’ A1 for a statement e.g. ‘If fewer than this in the group took less than 18 (seconds)’, or ‘Gareth needs to be in the first 10 (pupils) in the group’, or ‘Gareth could be one of the fastest in the 15 to 25 group’ |
| (ii) Valid explanation e.g. ‘The times of the 24 pupils in the 15 to 25 second group could be closer to 15 seconds’ or ‘There could be more times than expected in the range 15 to 18 seconds’, or ‘Gareth could be one of the slowest people in the 15 to 25 second group’, or ‘There could be 10 pupils quicker than him in the 15 to 25 group’, or ‘The median could be lower than 18’, or ‘He could be one of the other 14 in the group 15 to 25’ | E1 | FT ‘their 90’ Do not accept e.g. ‘Gareth could have been slower than the 45th person’ |