
Higher November 2018 Unit 2 Q11
11. Sketch the curve \(y = \tan x\), for values of \(x\) in the range \(x\) = – 180° to \(x\) = 180°. [2]
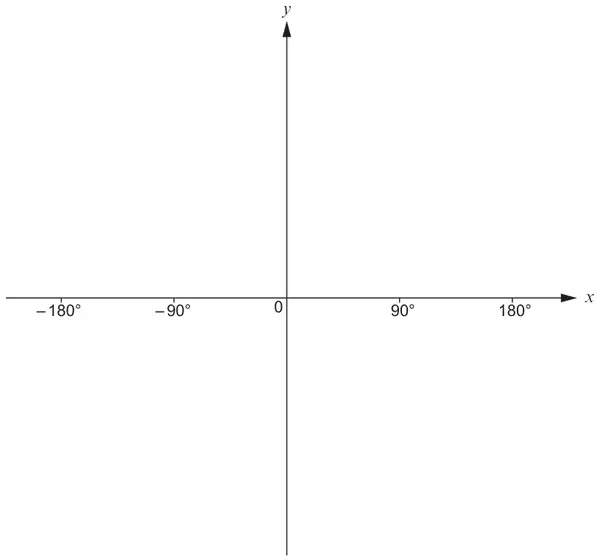
| Scheme | Marks | Comments |
|---|---|---|
Correct sketch, with inflection points at (-180,0), (0,0) and (180,0) AND graph tending towards the vertical asymptotes at \(x = -90\) and \(x = 90\).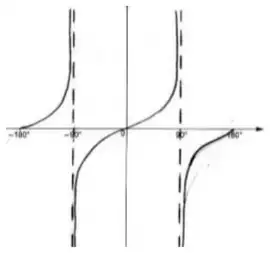 | B2 | If vertical asymptotes are not seen, they may be implied by a break in the curve of ‘their sketch’ at \(x = -90\) and \(x = 90\) provided there is asymptotic behaviour. Graph must be attempted from \(x = -180\) to \(x = 180\). Ignore continuation of sketch for x<-180 and x>180. B1 for a sketch with inflection points at (-180,0), (0,0) and (180,0) only OR vertical asymptotes seen at \(x = -90\) and \(x = 90\) only. |