
Intermediate November 2018 Unit 1 Q17
17. A biased six-sided dice is thrown a total of 1000 times.
The graph shows the relative frequency of throwing a ‘six’ after 200, 400, 600, 800 and 1000 throws.
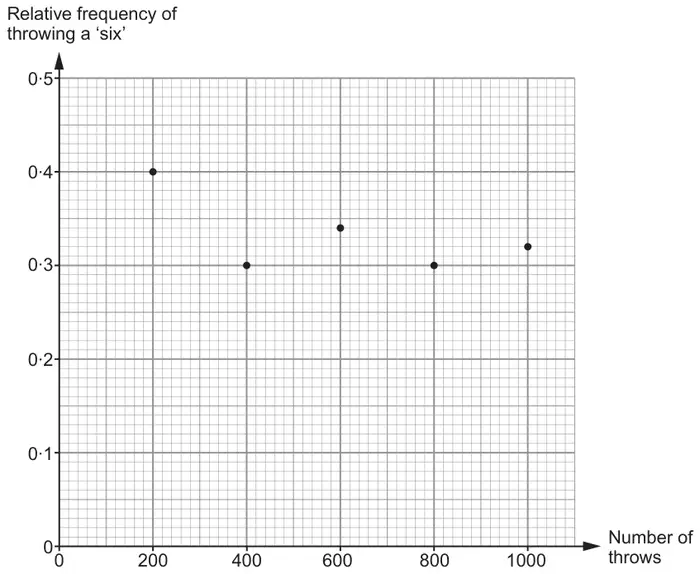
(a) Which of the following is the best estimate for the probability of throwing a ‘six’ with this dice?
Circle your answer. [1]
Circle your answer. [1]
0·4 0·3 0·5 0·32 0·34
(b)
(i) How many ‘sixes’ were thrown in the first 600 throws of the dice? [2]
(ii) How many more ‘sixes’ were recorded for these 600 throws than you would expect when a fair six-sided dice is thrown 600 times? [2]
| Scheme | Marks | Comments |
|---|---|---|
| 0·32 | B1 |
| Scheme | Marks | Comments |
|---|---|---|
| (i) 600 × 0·34 | M1 | |
| = 204 | A1 | |
| (ii) 204 – 600/6 | M1 | FT ‘their 204’. |
| =104 | A1 | M1A1 for ‘104 out of 600’ BUT M1A0 for ‘104/600’. FT for A1 provided answer is a positive integer. |