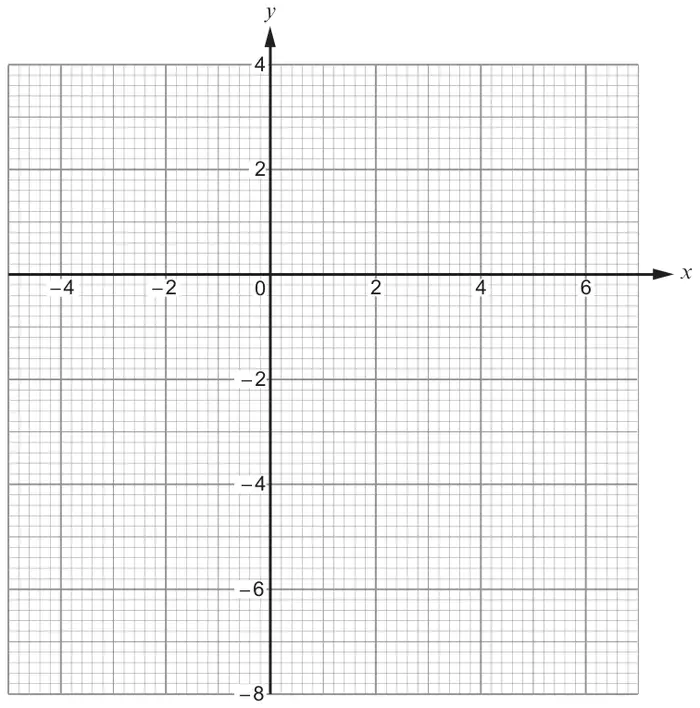
3. The table below shows some values of \(y = x - 3\) for values of \(x\) from −4 to 6.
\(x\)
−4
−2
0
2
4
6
\(y = x - 3\)
−7
−3
3
(a) Complete the table above. [2]
(b) On the graph paper below, draw the graph of the straight line \(y = x - 3\) for values of \(x\) from −4 to 6 only. [2]
(c) The straight line you have drawn on the graph for values of \(x\) from −4 to 6 is a diagonal of a square. Write down the coordinates of the four corners of this square. [2]
B2 for all three correct. B1 for one or two correct.
Mark scheme (b)
Scheme
Marks
Comments
Correct plots.
P1
FT ‘their y-values at x = −2, 2 and 4’. 2 correct plots sufficient as they are told it’s a straight line. Allow ±’½ a small square’. P0 if any incorrect plot.
Straight line from (−4,−7) to (6,3)
L1
CAO no FT. Allow ±’1 small square’. Must be from (−4,−7) to (6,3) but allow ‘extended’ line. A correct line gains P1L1.
Mark scheme (c)
Scheme
Marks
Comments
(−4,−7) (6,−7) (6,3) (−4,3) (In any order)
B2
B2 for all four correct. B1 for three correct. Only award B1(not B2) if all four correct coordinates given for their extended line. If L0 from a ‘shortened correct line’ then FT (for B2 or B1). If L0 from an incorrect line then FT (for B2 or B1) only if a quadrilateral has been drawn using ‘their line’ as a diagonal.
SC1 for thecorrect square drawn but no (or incorrect) coordinates given.
We'd like to use Google Analytics cookies to count visits and see which pages help most. They're optional, and the site works exactly the same either way. Privacy policy