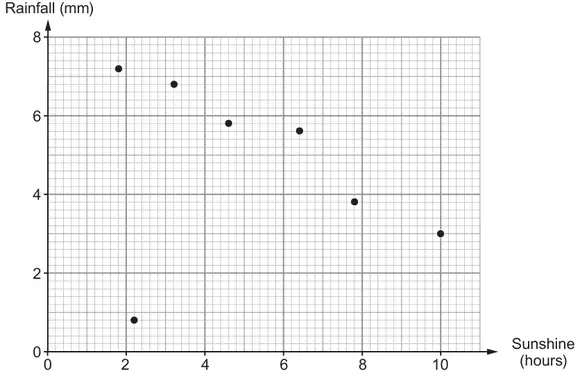
(a) Rosie recorded the rainfall and the number of hours of sunshine each day last week.
(i) On one day last week, the number of hours of sunshine was low and the rainfall was lower than on any other day. Which day was it? Circle your answer. [1]
Saturday Sunday Monday Tuesday Can’t tell
(ii) Rosie says,
There will be a positive correlation between rainfall and the number of hours of sunshine next week.
Is Rosie correct?
Yes ☐ No ☐
You must give a reason for your answer. [1]
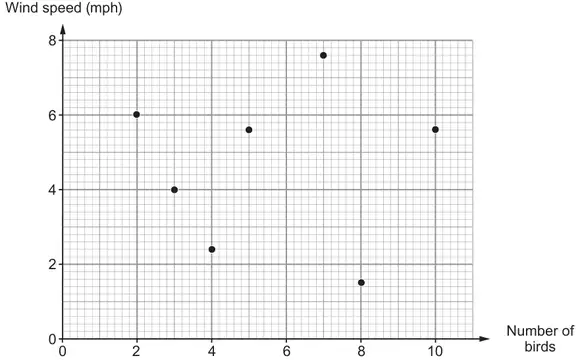
(b) At 3 p.m. each day last week, Rosie recorded the wind speed and the number of birds feeding in her garden.
(i) Was there a correlation between wind speed and the number of birds feeding in Rosie’s garden last week?
Yes ☐ No ☐
You must give a reason for your answer. [1]
(ii) The greatest wind speed at 3 p.m. last week was on Tuesday. How many birds were feeding in Rosie’s garden at this time? [1]
…………… birds
(iii) On Wednesday last week, the wind speed at 3 p.m. was a quarter of that on Friday. Complete the following table. [2]
Day
Wind speed (mph)
Wednesday
……………
Friday
……………
Mark scheme (a)
(a)(i)
Scheme
Marks
Comments
Can’t tell
B1
(a)(ii)
Scheme
Marks
Comments
Unambiguously stating or implying ‘No’ with a reason, e.g. ‘shows negative correlation (this week)’, ‘likely to be similar to this week’, ‘more rain, less sunshine’
E1
Allow ‘No’ with, e.g. ‘can’t tell from this week’, ‘can’t predict the weather (from last week)’, ‘can’t know this’
Do not accept, e.g. ‘you can’t have a positive correlation (both can’t increase)’
Mark scheme (b)
(b)(i)
Scheme
Marks
Comments
Unambiguously stating or implying ‘No’ with a reason, e.g. ‘all scattered’ ‘no relationship’,
E1
If a satisfactory reason is given ignore any further spurious comments
Allow, e.g. ‘no pattern’, ‘no trend’, ‘no steady plotted points’, ‘you can’t draw a line of best fit’, ‘no steady line’, ‘they are not in a line’, ‘random points’, ‘points all over the place’, ‘plots are everywhere’, ‘no link’
Do not accept, e.g. ‘no correlation’ ‘there were lots of birds in the garden when the wind speed was low and high’, ‘too many outliers’, ‘spread far apart’
(b)(ii)
Scheme
Marks
Comments
7 (birds)
B1
(b)(iii)
Scheme
Marks
Comments
Day
Wind speed (m.p.h.)
Wednesday
1.5
Friday
6(.0)
B1 B1
If no marks, award B1 if the results are reversed
If no marks, award SC1 for answers of (Wednesday) 1.4 and (Friday) 5.6
We'd like to use Google Analytics cookies to count visits and see which pages help most. They're optional, and the site works exactly the same either way. Privacy policy