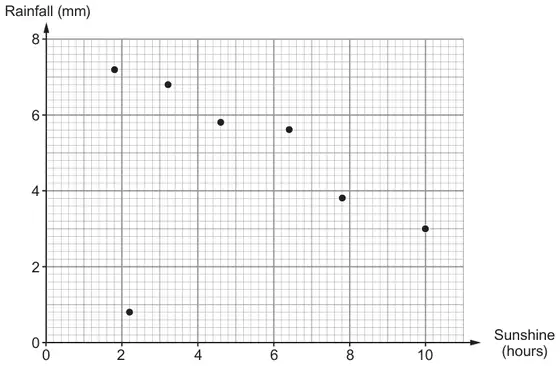
(a) Rosie recorded the rainfall and the number of hours of sunshine each day last week.
(i) The number of hours of sunshine on Sunday was double the number of hours of sunshine on Monday. Mark, with the letter S, the point on the scatter diagram that shows Sunday’s data. [1]
(ii) Rosie says,
“There will be a positive correlation between rainfall and the number of hours of sunshine next week.”
Is Rosie correct?
Yes ☐ No ☐
You must give a reason for your answer. [1]
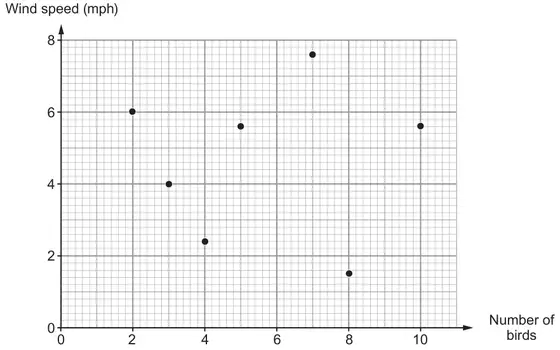
(b) At 3 p.m. each day last week, Rosie recorded the wind speed and the number of birds feeding in her garden.
On Wednesday last week, the wind speed at 3 p.m. was a quarter of that on Friday. Complete the following table. [2]
Day
Wind speed (mph)
Wednesday
……………………
Friday
……………………
Mark scheme (a)
(i)
Scheme
Marks
Comments
(6.4, 5.6) unambiguously marked
B1
(ii)
Scheme
Marks
Comments
Unambiguously stating or implying ‘No’ with a reason, e.g. ‘shows negative correlation (this week)’, ‘likely to be similar to this week’, ‘more rain, less sunshine’
E1
Allow ‘No’ with, e.g. ‘can’t tell from this week’, ‘can’t predict the weather (from last week)’, ‘can’t know this’
Do not accept, e.g. ‘you can’t have a positive correlation (both can’t increase)’
Mark scheme (b)
Scheme
Marks
Comments
Day
Wind speed (m.p.h.)
Wednesday
1.5
Friday
6(.0)
B1 B1
If no marks, award B1 if the results are reversed
If no marks, award SC1 for answers of (Wednesday) 1.4 and (Friday) 5.6
We'd like to use Google Analytics cookies to count visits and see which pages help most. They're optional, and the site works exactly the same either way. Privacy policy