
Numeracy Foundation November 2021 Unit 1 Q6
6. A water tank is filled every morning.
The graph below shows the depth of water in the tank between 8:00 a.m. and 9:00 a.m. on Friday and Saturday.
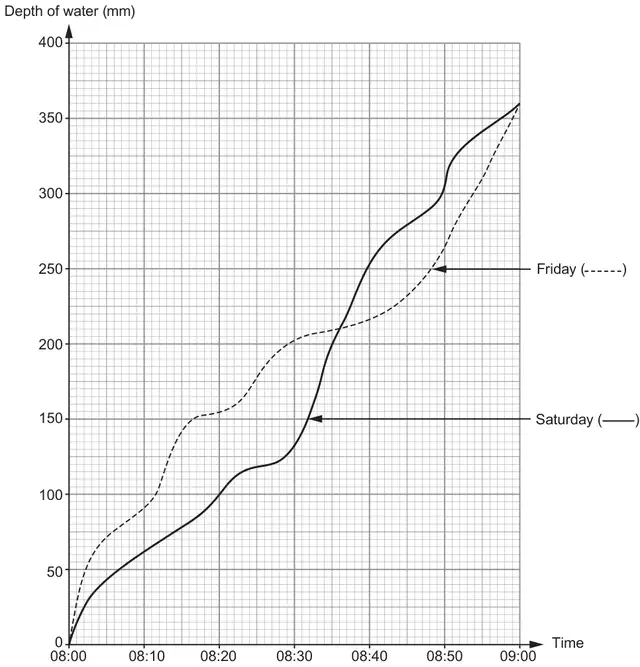
What was the difference between the depth of water on Friday and on Saturday at 8:20 a.m.? [2]
On both days, the tank filled with water to a depth of 360 mm.
On which day did this happen more quickly?
Friday ☐ Saturday ☐ The same for both days ☐
You must give a reason for your answer. [1]
Consider the time interval between 8:10 a.m. and 8:50 a.m.
At what time was the depth of the water in the tank the same on both Friday and Saturday? [1]
On which day did the water tank fill more quickly between 8:30 a.m. and 8:40 a.m.?
Friday ☐ Saturday ☐ Can’t tell ☐
You must give a reason for your answer. [1]
The tank can hold water to a depth of 400 mm.
On Saturday, at what time was the water in the tank half this depth? [1]
8:28 a.m. 8:20 a.m. 8:35 a.m. 8:12 a.m. 8:30 a.m.
| Scheme | Marks | Comments |
|---|---|---|
| 54 (mm) or 55 (mm) | B2 | B1 for sight of 154 (mm) or 155 (mm) |
| Scheme | Marks | Comments |
|---|---|---|
| Indicates or unambiguously implies ‘The same on both days’ with a reason, e.g. ‘both the same at 9 a.m.’, ‘both at the same time’, ‘both full at 9 a.m.’, ‘both took 1 hour’ ‘both at 360mm at the same time’, ‘they start and finish at the same time’, ‘both meet the depth of water at the same time’ | E1 | Allow reference to ‘both tanks’ rather than ‘both days’ If a correct statement is made, ignore additional incorrect or spurious statements Allow ‘same on both days’ with a reason, e.g. ‘both tanks have 360(mm)’, ‘the two lines meet at the same point’, ‘both tanks are filled (full) at the same time’, ‘the 2 lines finish at the same time’, ‘both get there at the same time’ ‘both peak (get to the top of the graph) at the same time’ Do not accept, e.g. ‘the 2 lines show the same information’, ‘the 2 lines are the same’, ‘he put water in the tank for both days’ ‘both tanks are filling at the same time’ |
| Scheme | Marks | Comments |
|---|---|---|
| 8(:)36 a.m. or 08(:)36 | B1 | Allow (0)8(:)36 (a.m.) Do not accept (0)8(:)36 p.m. Allow time reference to ‘just before 08(:)36’ or equivalent, but NOT 08(:)35 |
| Scheme | Marks | Comments |
|---|---|---|
| Indicates or unambiguously implies Saturday with a reason, e.g. ‘steeper (rise)’, ‘gradient is more’, ‘over 100mm on Saturday but only about 15 mm on Friday’ | E1 | Allow additional spurious statements or incorrect values if clearly stating ‘steeper’ or similar Allow Saturday with, e.g. ‘steep gradient’, ‘steep rise’, ‘(approximately) 120 (mm) on Saturday’, ‘(only) 14 (mm) on Friday’, ‘Saturday with steep drop’, ‘Saturday’s water had increased more than Friday’ ‘the depth of water is greater in the 10 minutes’, ‘the line moves up faster on Saturday’, ‘it increases from 130 to 250(mm) on Saturday’, ‘it increases from 130 to 255(mm) on Saturday’, ‘it’s a straight line going up so it is quicker’, ‘filled up quicker, line goes straight up unlike Friday’ Allow values for:
‘Saturday has 250mm and Friday has 215mm’, ‘more water has been used on Saturday’, ‘the curve is more on Saturday’, ‘because it had more water in it’, ‘Saturday is faster than Friday’, ‘Saturday’s time has increased more than on Friday’ |
| Scheme | Marks | Comments |
|---|---|---|
| 8:35 a.m. | B1 |