
Numeracy Foundation November 2020 Unit 1 Q11
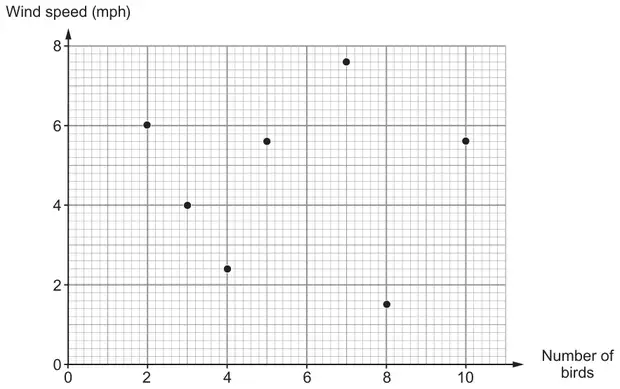
11. At 3 p.m. each day last week, Rosie recorded the wind speed and the number of birds feeding in her garden.
(a)
Was there a correlation between wind speed and the number of birds feeding in Rosie’s garden last week?
Yes ☐ No ☐
You must give a reason for your answer. [1]
(b)
The greatest wind speed at 3 p.m. last week was on Tuesday.
How many birds were feeding in Rosie’s garden at this time? [1]
…………………… birds
| Scheme | Marks | Comments |
|---|---|---|
| Unambiguously stating or implying ‘No’ with a reason, e.g. ‘all scattered’ ‘no relationship’, | E1 | If a satisfactory reason is given ignore any further spurious comments Allow, e.g. ‘no pattern’, ‘no trend’, ‘no steady plotted points’, ‘you can’t draw a line of best fit’, ‘no steady line’, ‘they are not in a line’, ‘random points’, ‘points all over the place’, ‘plots are everywhere’, ‘no link’ Do not accept, e.g. ‘no correlation’ ‘there were lots of birds in the garden when the wind speed was low and high’, ‘too many outliers’, ‘spread far apart’ |
| Scheme | Marks | Comments |
|---|---|---|
| 7 (birds) | B1 |