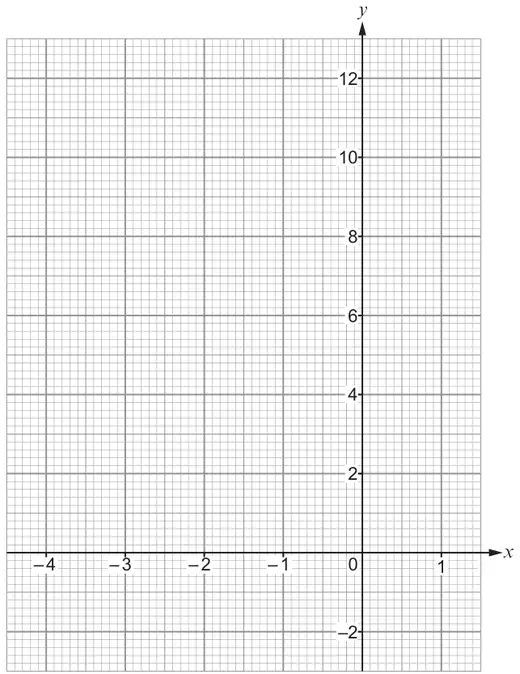
13. The table below shows some of the values of \(y = x^2 + 4x + 5\) for values of \(x\) from –4 to 1.
\(x\)
–4
–3
–2
–1
0
1
\(y = x^2 + 4x + 5\)
5
2
2
5
(a) Complete the table by finding the value of \(y\) for \(x\) = –2 and for \(x\) = 1. [2]
(b) On the graph paper below, draw the graph of \(y = x^2 + 4x + 5\) for values of \(x\) from –4 to 1. [2]
Mark scheme (a)
Scheme
Marks
Comments
1 10
B2
B1 for each. Table takes precedence if conflicting values given.
Mark scheme (b)
Scheme
Marks
Comments
At least 4 correct plots and no incorrect plot.
P1
FT ‘their (−2,1)’ and ‘their (1,10)’ OR (−2,1) and (1,10) plotted. Allow ± ‘½ a small square’.
A smooth curve drawn through their plots.
C1
FT ‘their 6 plots’. OR a curve through the 4 given points AND (−2,1) and (1,10) Allow intention to pass through their plots. (± 1 small square horizontally or vertically.)
We'd like to use Google Analytics cookies to count visits and see which pages help most. They're optional, and the site works exactly the same either way. Privacy policy