
Higher November 2021 Unit 1 Q3
3. Complete the table below.
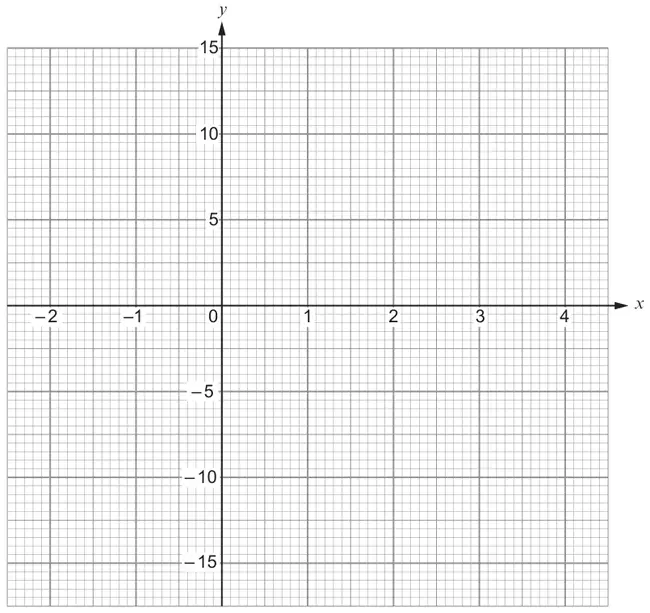
Draw the graph of \(y = 7 - x^2\) for values of \(x\) between −2 and 4.
Use the graph paper below. [4]
| \(x\) | −2 | −1 | 0 | 1 | 2 | 3 | 4 |
|---|---|---|---|---|---|---|---|
| \(y = 7 - x^2\) | 3 | 7 | 6 | 3 | −9 |
| Scheme | Marks | Comments |
|---|---|---|
| 6 −2 | B2 | B1 for each. |
| At least 5 correct plots and no incorrect plot. | P1 | F.T. ‘their (−1,6)’ AND ‘their (3,−2)’. Allow ±‘\(\tfrac{1}{2}\) a small square’. |
| A smooth curve drawn through their plots. | C1 | F.T. ‘their 7 plots’ OR a curve through the 5 given plots AND (−1,6) AND (3,−2). Allow for the intention to pass through their plots (within 1 small square, either horizontally or vertically of the point). |