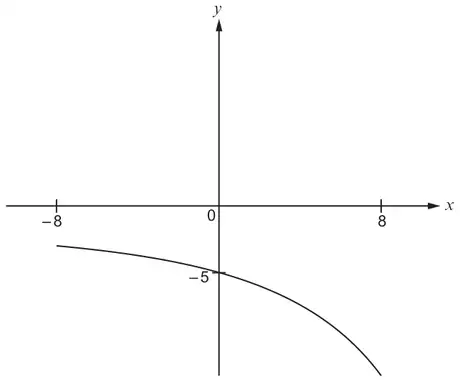
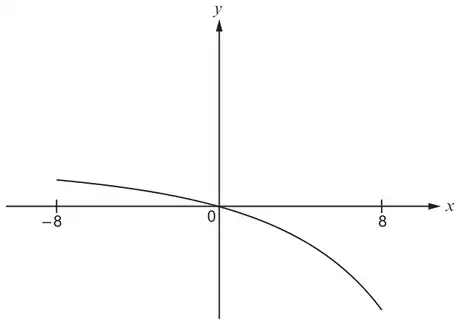
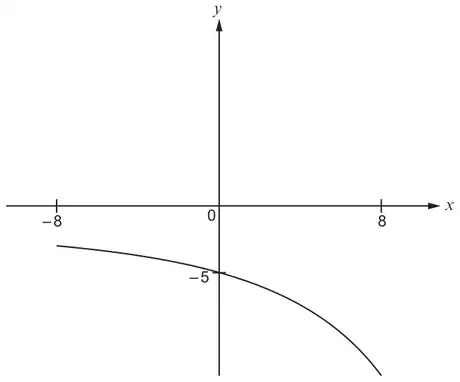
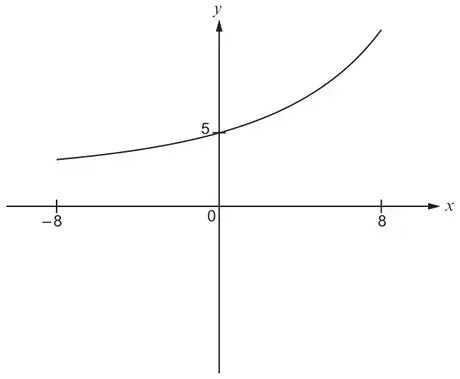
Higher November 2020 Unit 1 Q17WJECHigherCurrent spec2 marksGraphical Transformations17.(a) The following diagram shows a sketch of the curve \(y = f(x)\).The curve is transformed, as shown below.Using function notation, complete the equation of the transformed curve. [1]\(y =\) ……………………(b) The following diagram again shows a sketch of the curve \(y = f(x)\).The curve is transformed, as shown below.Using function notation, complete the equation of the transformed curve. [1]\(y =\) ……………………Mark scheme (a)Mark scheme (b)Mark scheme (a)SchemeMarksComments\(y = f(x) + 5\)B1Correct notation required.Mark scheme (b)SchemeMarksComments\(y = -f(x)\)B1Correct notation required.