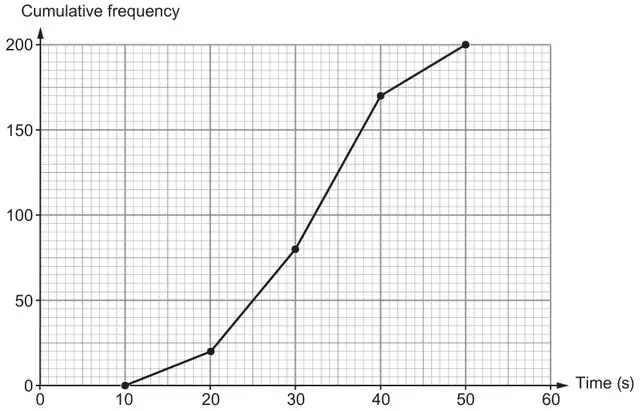
(a) On 1st June last year, 200 customers used cash to pay at Shop Lil. The cumulative frequency diagram represents the time each of these 200 customers waited to be given change at the checkout.
(i) How many of these customers waited between 30 and 50 seconds for their change? [2]
(ii) Use the graph to estimate the median time these 200 customers waited for their change. Circle your answer. [1]
(iii) Calculate the fraction of these 200 customers who waited 40 seconds or longer for their change. Give your answer in its simplest form. [2]
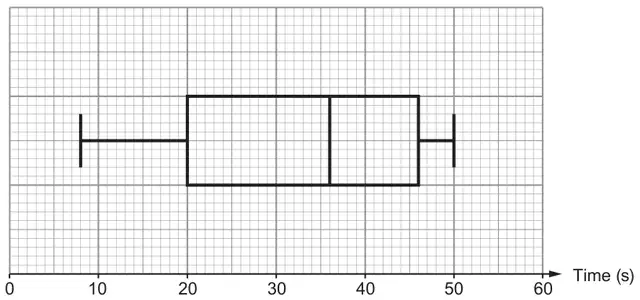
(b) On 1st June this year, the manager at Shop Lil drew a box-and-whisker plot of the times 200 customers waited for their change at the checkout.
Based on the results of these 200 customers, the manager made the following statements. Complete the statements.
(i) “On 1st June this year, 50% of our customers were given their change in …………… seconds or less.” [1]
(ii) “On 1st June this year, the interquartile range of the times taken to give customers their change was …………… seconds.” [2]
(c) Consider the 50 customers waiting the longest times to get their change on 1st June last year and this year. Has the speed of giving change at the checkout improved since last year?
Yes ☐ No ☐
You must give a reason for your answer. [1]
Mark scheme (a)
(i)
Scheme
Marks
Comments
200 – 80 or 90 + 30
M1
120 (customers)
A1
(ii)
Scheme
Marks
Comments
32 seconds
B1
(iii)
Scheme
Marks
Comments
\(\dfrac{200-170}{200}\) or \(\dfrac{30}{200}\) or \(\dfrac{15}{100}\)
M1
Award M1 for 0.15 or 15%
\(\dfrac{3}{20}\)
A1
Only ignore further working if written as 0.15 or 15%
If no marks, award SC1 for an answer of \(\dfrac{17}{20}\) (from 40 seconds or less)
Mark scheme (b)
(i)
Scheme
Marks
Comments
36
B1
(ii)
Scheme
Marks
Comments
46 – 20
M1
Allow 20 – 46
26
A1
Mark scheme (c)
Scheme
Marks
Comments
‘No’ unambiguously stated or implied AND a reason, e.g. ‘upper quartile is higher this year’ ‘75% reading higher this year’ ‘interval was 37 (or 38) to 50 seconds last year, this year it is 46 to 50 seconds’
E1
Do not ignore incorrect values for the upper quartiles given, E0 if ‘upper quartile’ or ‘75%’ stated with incorrect upper quartile readings
Allow ‘No’ with a reason, e.g. ‘(last year) 38, (this year) 46’ ‘(last year) 37.(…), (this year) 46’
Do not accept, e.g. ‘range greater this year’ ‘lower quartile is lower this year’ ‘median higher this year’ ‘customers still waiting at 50 seconds’
We'd like to use Google Analytics cookies to count visits and see which pages help most. They're optional, and the site works exactly the same either way. Privacy policy