
Higher June 2025 Unit 2 Q1
1. The diagram below shows two towns, \(A\) and \(B\), on a map.
The scale of the map is 1 cm represents 4·5 km.
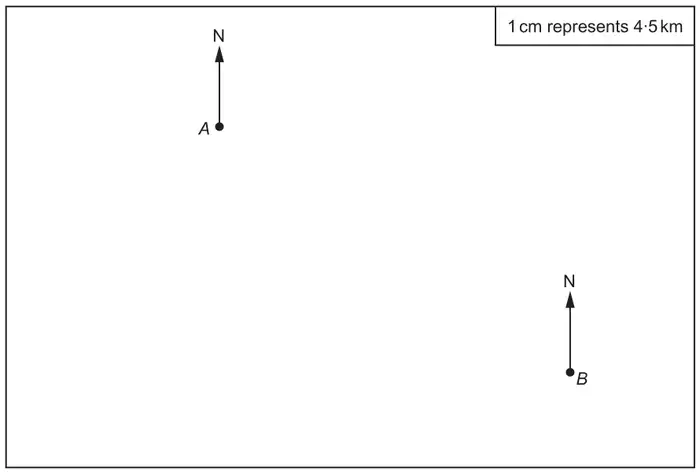
On screen this diagram may not be shown at actual size. To measure it, use the question paper (PDF) printed at 100%.
On the map, shade the region containing all the points that are:
- closer to town \(A\) than to town \(B\), and
- less than 27 km from town \(B\).
[4]
| Scheme | Marks | Comments |
|---|---|---|
| Use tolerances ± 2 mm | ||
| Perpendicular bisector of the line \(AB\) | B1 | For B1, the bisector must be of sufficient length that crosses \(AB\) so as not to be considered a ‘point’ or a ‘notch’ i.e. at least 2 cm. |
| Arc of radius 6 cm from \(B\) | B2 | For B2 or B1, the arc must be of sufficient length so as not to be considered a ‘point’ or a ‘notch’ i.e. for a sector of at least 10° at B. Award B1 for the appropriate sight of one of the following:
|
Correct region identified within the map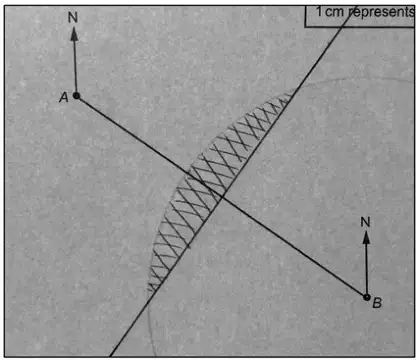 | B1 | Ignore shading outside map. Strict FT for a suitable region bounded by a line crossing \(AB\) and an arc from either \(A\) or \(B\) but outside of tolerances and provided at least B1 previously awarded. |