
May 2023 Paper 2 Q4
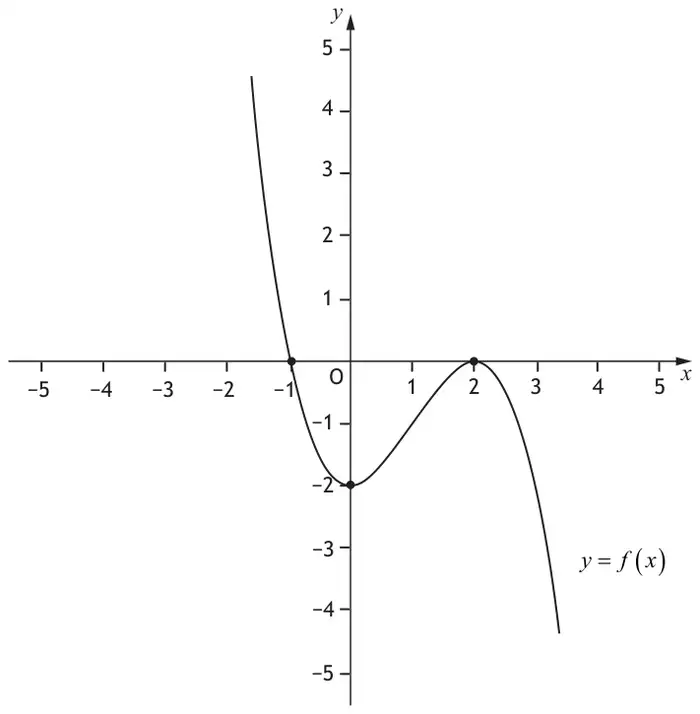
4. The diagram shows the cubic graph of \(y=f(x)\), with stationary points at (2, 0) and (0, −2).
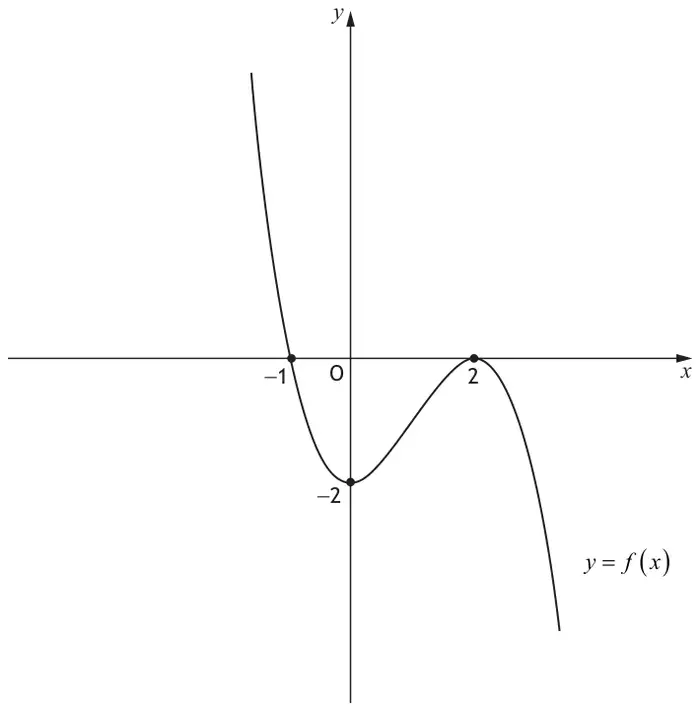
On the diagram below, sketch the graph of \(y=2f(-x)\). [2]
| Mark | Generic scheme | Illustrative scheme |
|---|---|---|
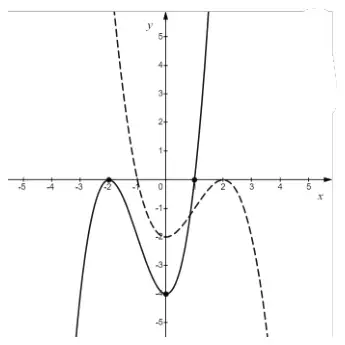
| •1 | reflect in the \(y\)-axis | cubic graph with max at \((-2,0)\) and passing through \((1,0)\) |
| •2 | apply appropriate vertical scaling |
|
| (2) |
Notes:
- Where candidates do not sketch a cubic function award 0/2.
- For transformations of the form \(f(-x)+k\) or \(-f(x+k)\) award 0/2.
- If the transformation has not been applied to all coordinates, award 0/2.
Commonly Observed Responses:
| Function | Transformation of (−1,0) and (2,0) | Transformation of (0,−2) | Shape | Award |
|---|---|---|---|---|
| Incorrect orientation | (−2,0) and (1, 0) | (0,−4) |  | 0/2 |
| \(-2f(x)\) | (−1,0) and (2,0) | (0,4) |  | 1/2 |
| \(-2f(-x)\) | (−2,0) and (1, 0) | (0,4) | | 1/2 |
| \(-2f(-2x)\) | (−1,0) and (\(\frac{1}{2}\),0) | (0,4) | | 0/2 |
| \(-2f\left(-\frac{x}{2}\right)\) | (−4,0) and (2,0) | (0,4) | | 0/2 |
| \(2f(x)\) | (−1,0) and (2,0) | (0,−4) | | 1/2 |
| \(2f(2x)\) | (\(-\frac{1}{2}\),0) and (1,0) | (0,−4) | | 1/2 |
| \(2f\left(\frac{x}{2}\right)\) | (−2,0) and (4,0) | (0,−4) | | 1/2 |
| \(2f\left(-\frac{x}{2}\right)\) | (−4,0) and (2,0) | (0,−4) | | 1/2 |
| \(2f(x-1)\) | (0,0) and (3,0) | (1,−4) | | 1/2 |
| \(f(-x)\) | (−2,0) and (1,0) | (0,−2) | | 1/2 |
| \(\frac{1}{2}f(-x)\) | (−2,0) and (1,0) | (0,−1) | | 1/2 |
| \(f(2x)\) | (\(-\frac{1}{2}\),0) and (1,0) | (0,−2) | | 0/2 |
| \(f(-2x)\) | (−1,0) and (\(\frac{1}{2}\),0) | (0,−2) | | 0/2 |
| \(f\left(-\frac{x}{2}\right)\) | (−4,0) and (2,0) | (0,−2) | | 0/2 |
| \(-f\left(\frac{x}{2}\right)\) | (−2,0) and (4,0) | (0,2) | | 0/2 |
| \(-f\left(-\frac{x}{2}\right)\) | (−4,0) and (2,0) | (0,2) | | 0/2 |