
AS June 2019 Further Unit 2 Q6
6. The University of Arizona surveyed a large number of households. One purpose of the survey was to determine if annual household income could be predicted from size of family home.
The graph of Annual household income, \(y\), versus Size of family home, \(x\), is shown below.
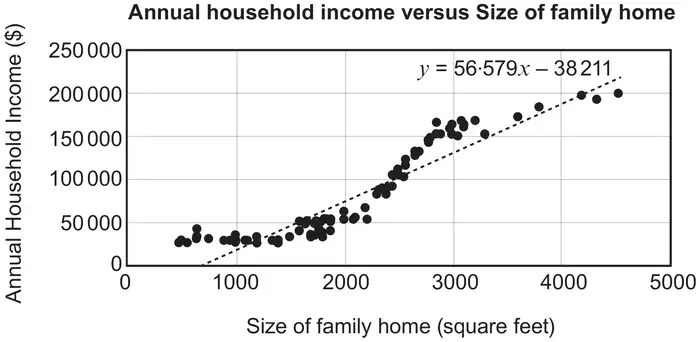
(a) State the limitations of using the regression line above with reference to the scatter diagram. [1]
The data for size of family homes between 2000 and 3000 square feet are shown in the diagram below.
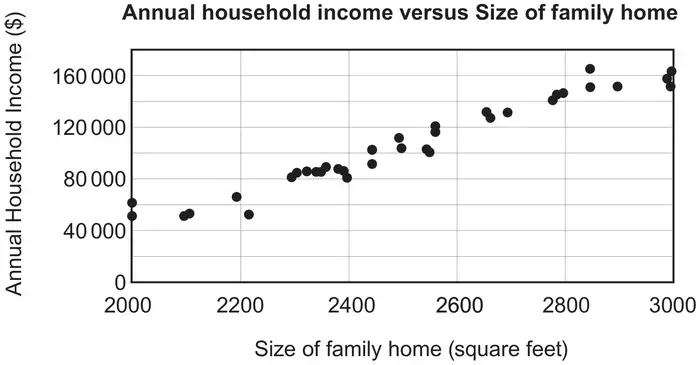
Summary statistics for these data are as follows.
\[\textstyle\sum x=93\,160\qquad\sum y=3\,907\,142\qquad n=37\]\[S_{xx}=2\,869\,673{\cdot}03\qquad S_{yy}=44\,312\,797\,167\qquad S_{xy}=348\,512\,820{\cdot}6\](b) Calculate the equation of the least squares regression line to predict Annual household income from Size of family home for these data. [5]
| Scheme | Marks | Comments |
|---|---|---|
| Valid comment. Eg. Data suggests a non-linear relationship. The scatter diagram seems to have three distinct sections. The regression line will give an underestimate for some values of x e.g. between 2500 and 4000 and an overestimate for others e.g. between 1500 and 2500. Three separate lines for the distinct sections would be better. | E1 |
| Scheme | Marks | Comments |
|---|---|---|
| \(b=\dfrac{348512820.6}{2869673.03}\) | M1 | |
| \(b=121.4468746\) | A1 | A1 121.4 or 121.45 or better |
| \({a=\dfrac{3907142}{37}-121.4468746\times\dfrac{93160}{37}}\) | M1 | |
| \(a=-200185.1037\) | A1 | A1 awrt -200000 |
| y = -200185 + 121.4x | A1 | A1 FT ‘their’ gradient and intercept dep on at least one M1 awarded. |
| Total [6] |